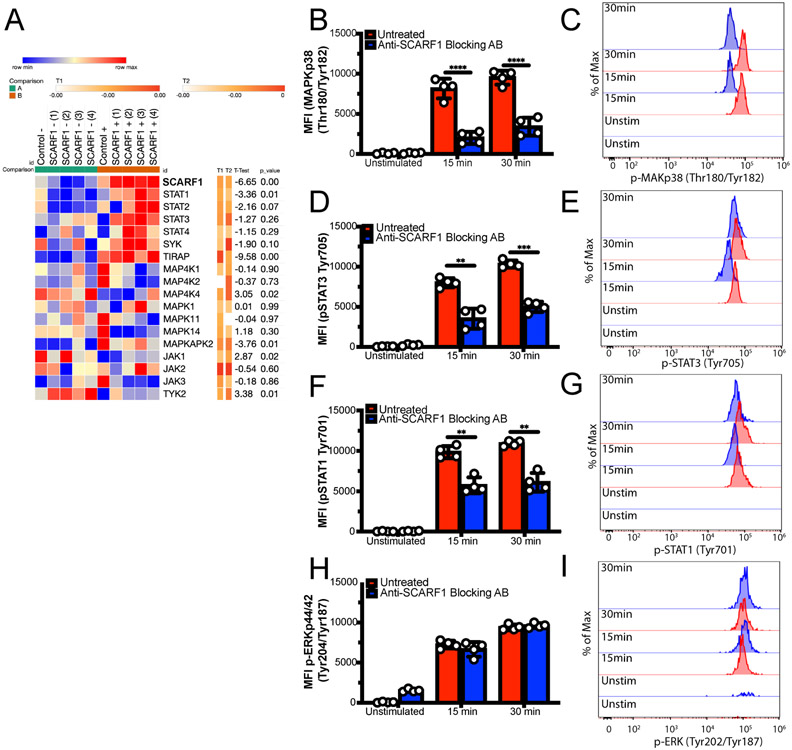
Figure 4. SCARF1 regulates AC-induced phosphorylation of MAPK and STAT Kinases.
(A) Upregulation of STAT genes in SCARF1+ BDCA1+ DCs. PBMCs were isolated from healthy controls and treated with apoptotic cells for 4 hours. Live CD11c+BDCA1+ DCs were sorted into SCARF1 negative (SCARF1Lo) or SCARF1 positive (SCARF1Hi) groups. mRNA was extracted, and the genetic profiling was measure by Nanostring immunology panel. Unbiased heatmap depicting the regulation of kinases. Gene expression as log 2 after normalization using Morpheus software. Representative heatmap of single Nanostring assay (n=4). U-unstimulated. P values by Students t-test. (B-I) SCARF1 is partly responsible for phosphorylation of kinases. PBMCs from healthy controls (1x10⁶/mL) were treated with SCARF1-blocking antibody for 30 min or left untreated, then Live/Dead-UV-labeled apoptotic cells were added for 15 or 30 minutes. Cells were immediately fixed and stained for flow cytometry. Cells were gated on CD11c+BDCA1+SCARF1+ in the presence or absence of apoptotic cells. Left panel: MFI quantification, Right panel: Representative histograms (B-C) p-MAPK p38 Thr180/Tyr182, (D-E) p-STAT3 Tyr705, (F-G) p-STAT1 Tyr701, (H-I) p-ERK p44/42 Thr202/Tyr204. MFI, mean fluorescent intensity. Data represent the mean (±SEM) of 2 independent experiments n= 4 independent individuals. P *(<0.02), ns (not significant) by the Mann-Whitney test.

