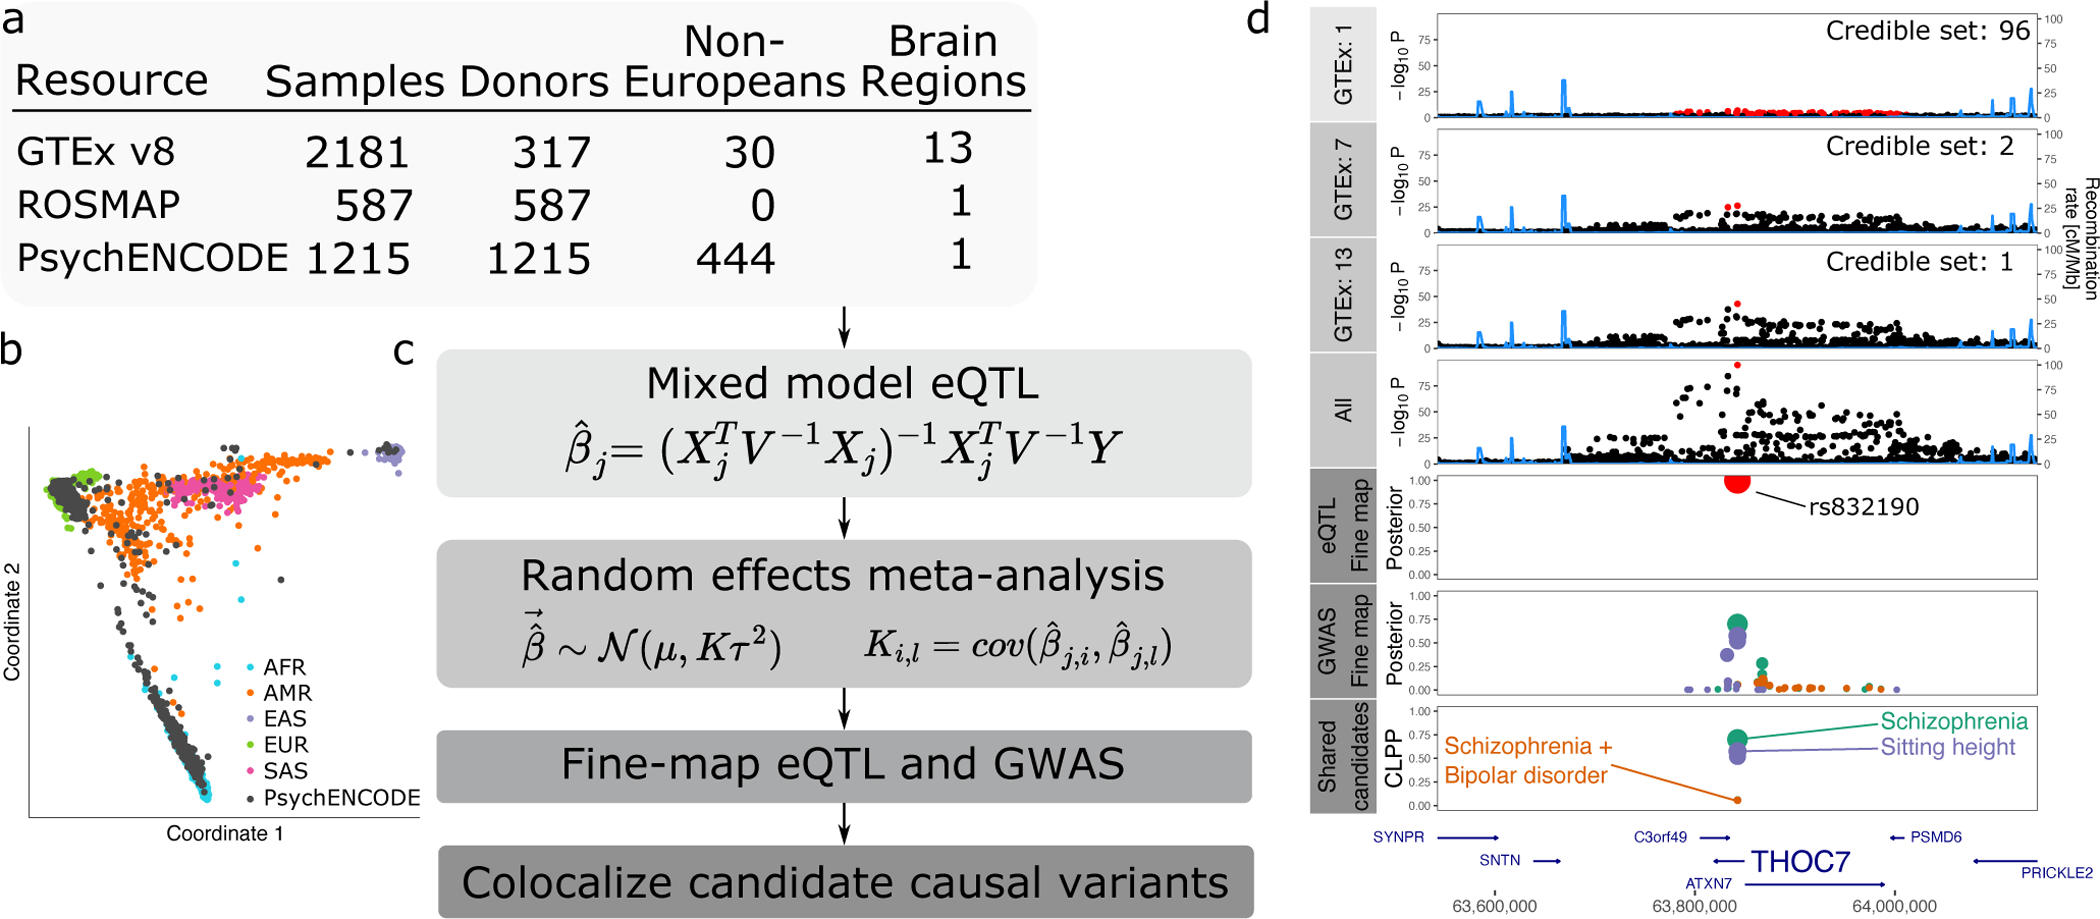
Figure 1: Workflow for multi-ancestry eQTL meta-analysis.

A) RNA-seq datasets with details about ancestry and repeated measures. B) Multidimensional scaling illustrating diverse ancestry of donors from PsychENCODE resource. C) mmQTL workflow is composed of eQTL analysis within each brain region for each resource using a linear mixed model to account for population stratification. Each analysis is then combined using a random effects meta-analysis that accounts for repeated measures from GTEx sample and effect size heterogeneity across brain regions and resources. Statistical fine-mapping is performed on GWAS and combined eQTL results separately. Finally, fine-mapping posterior probabilities from the eQTL analysis and each GWAS are combined to produce colocalization posterior probabilities (CLPP). D) Analysis of data for THOC7 from 1, 7 and 13 GTEx brain tissues, and addition of PsychENCODE and ROSMAP, reduces the size of the 95% credible sets indicated by red points. Statistical fine-mapping for this gene and integration with GWAS nominates a single candidate causal variant, rs832190, affecting SZ, a combined risk for SZ and BD, and sitting height in this region.
