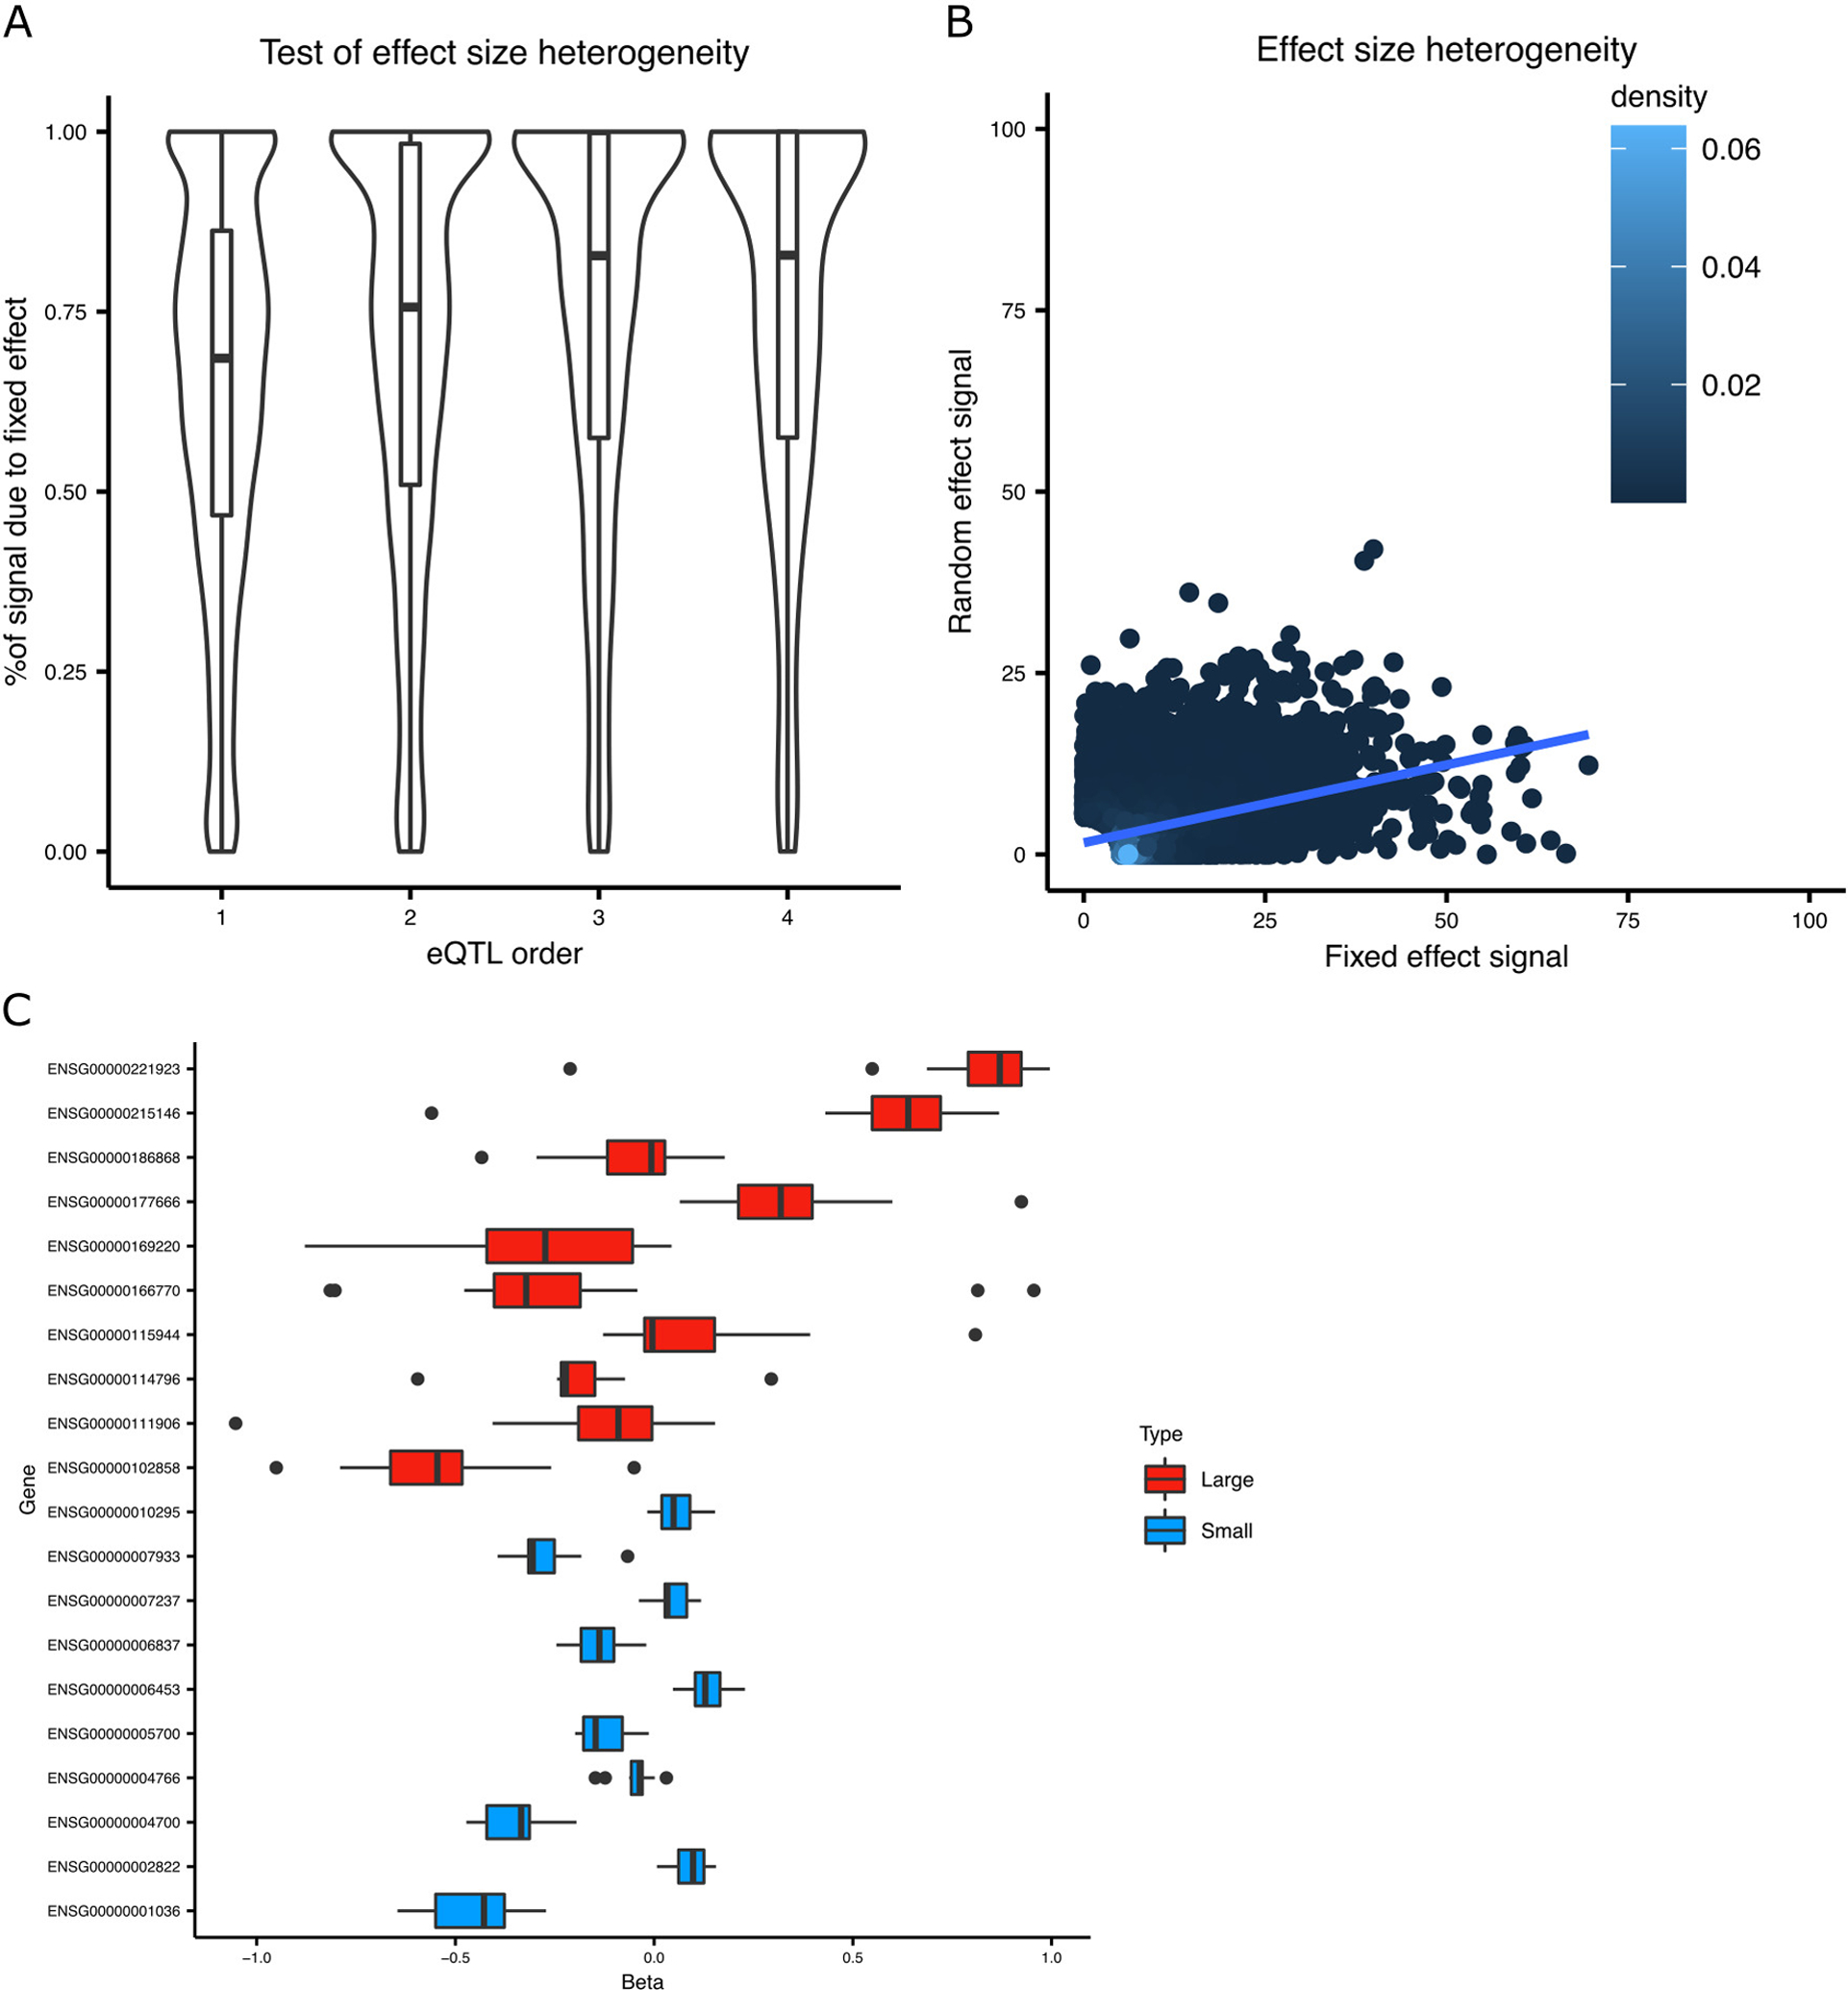
Extended Data Fig. 3. Impact of effect size heterogeneity.

The test statistic from the random effect meta-analysis used here (Han and Eskin, 2011) is the sum of statistics testing the mean (Smean) and variance (Svariance) of the estimated effect sizes. A) The percent of total signal contributed by the fixed effect (i.e. Smean / (Smean + Svariance)) is shown for the lead eQTL SNP for multiple orders of conditional analysis. Box plot indicates median, interquartile range (IQR) and 1.5*IQR. B) The relationship between the test statistics is visualized by plotting Svariance against Smean from the lead eQTL SNP from the primary eQTL analysis. C) The estimated effect sizes from the lead eQTL SNP for genes with high and low levels of effect size heterogeneity is shown. Box plot indicates median, interquartile range (IQR) and 1.5*IQR.
