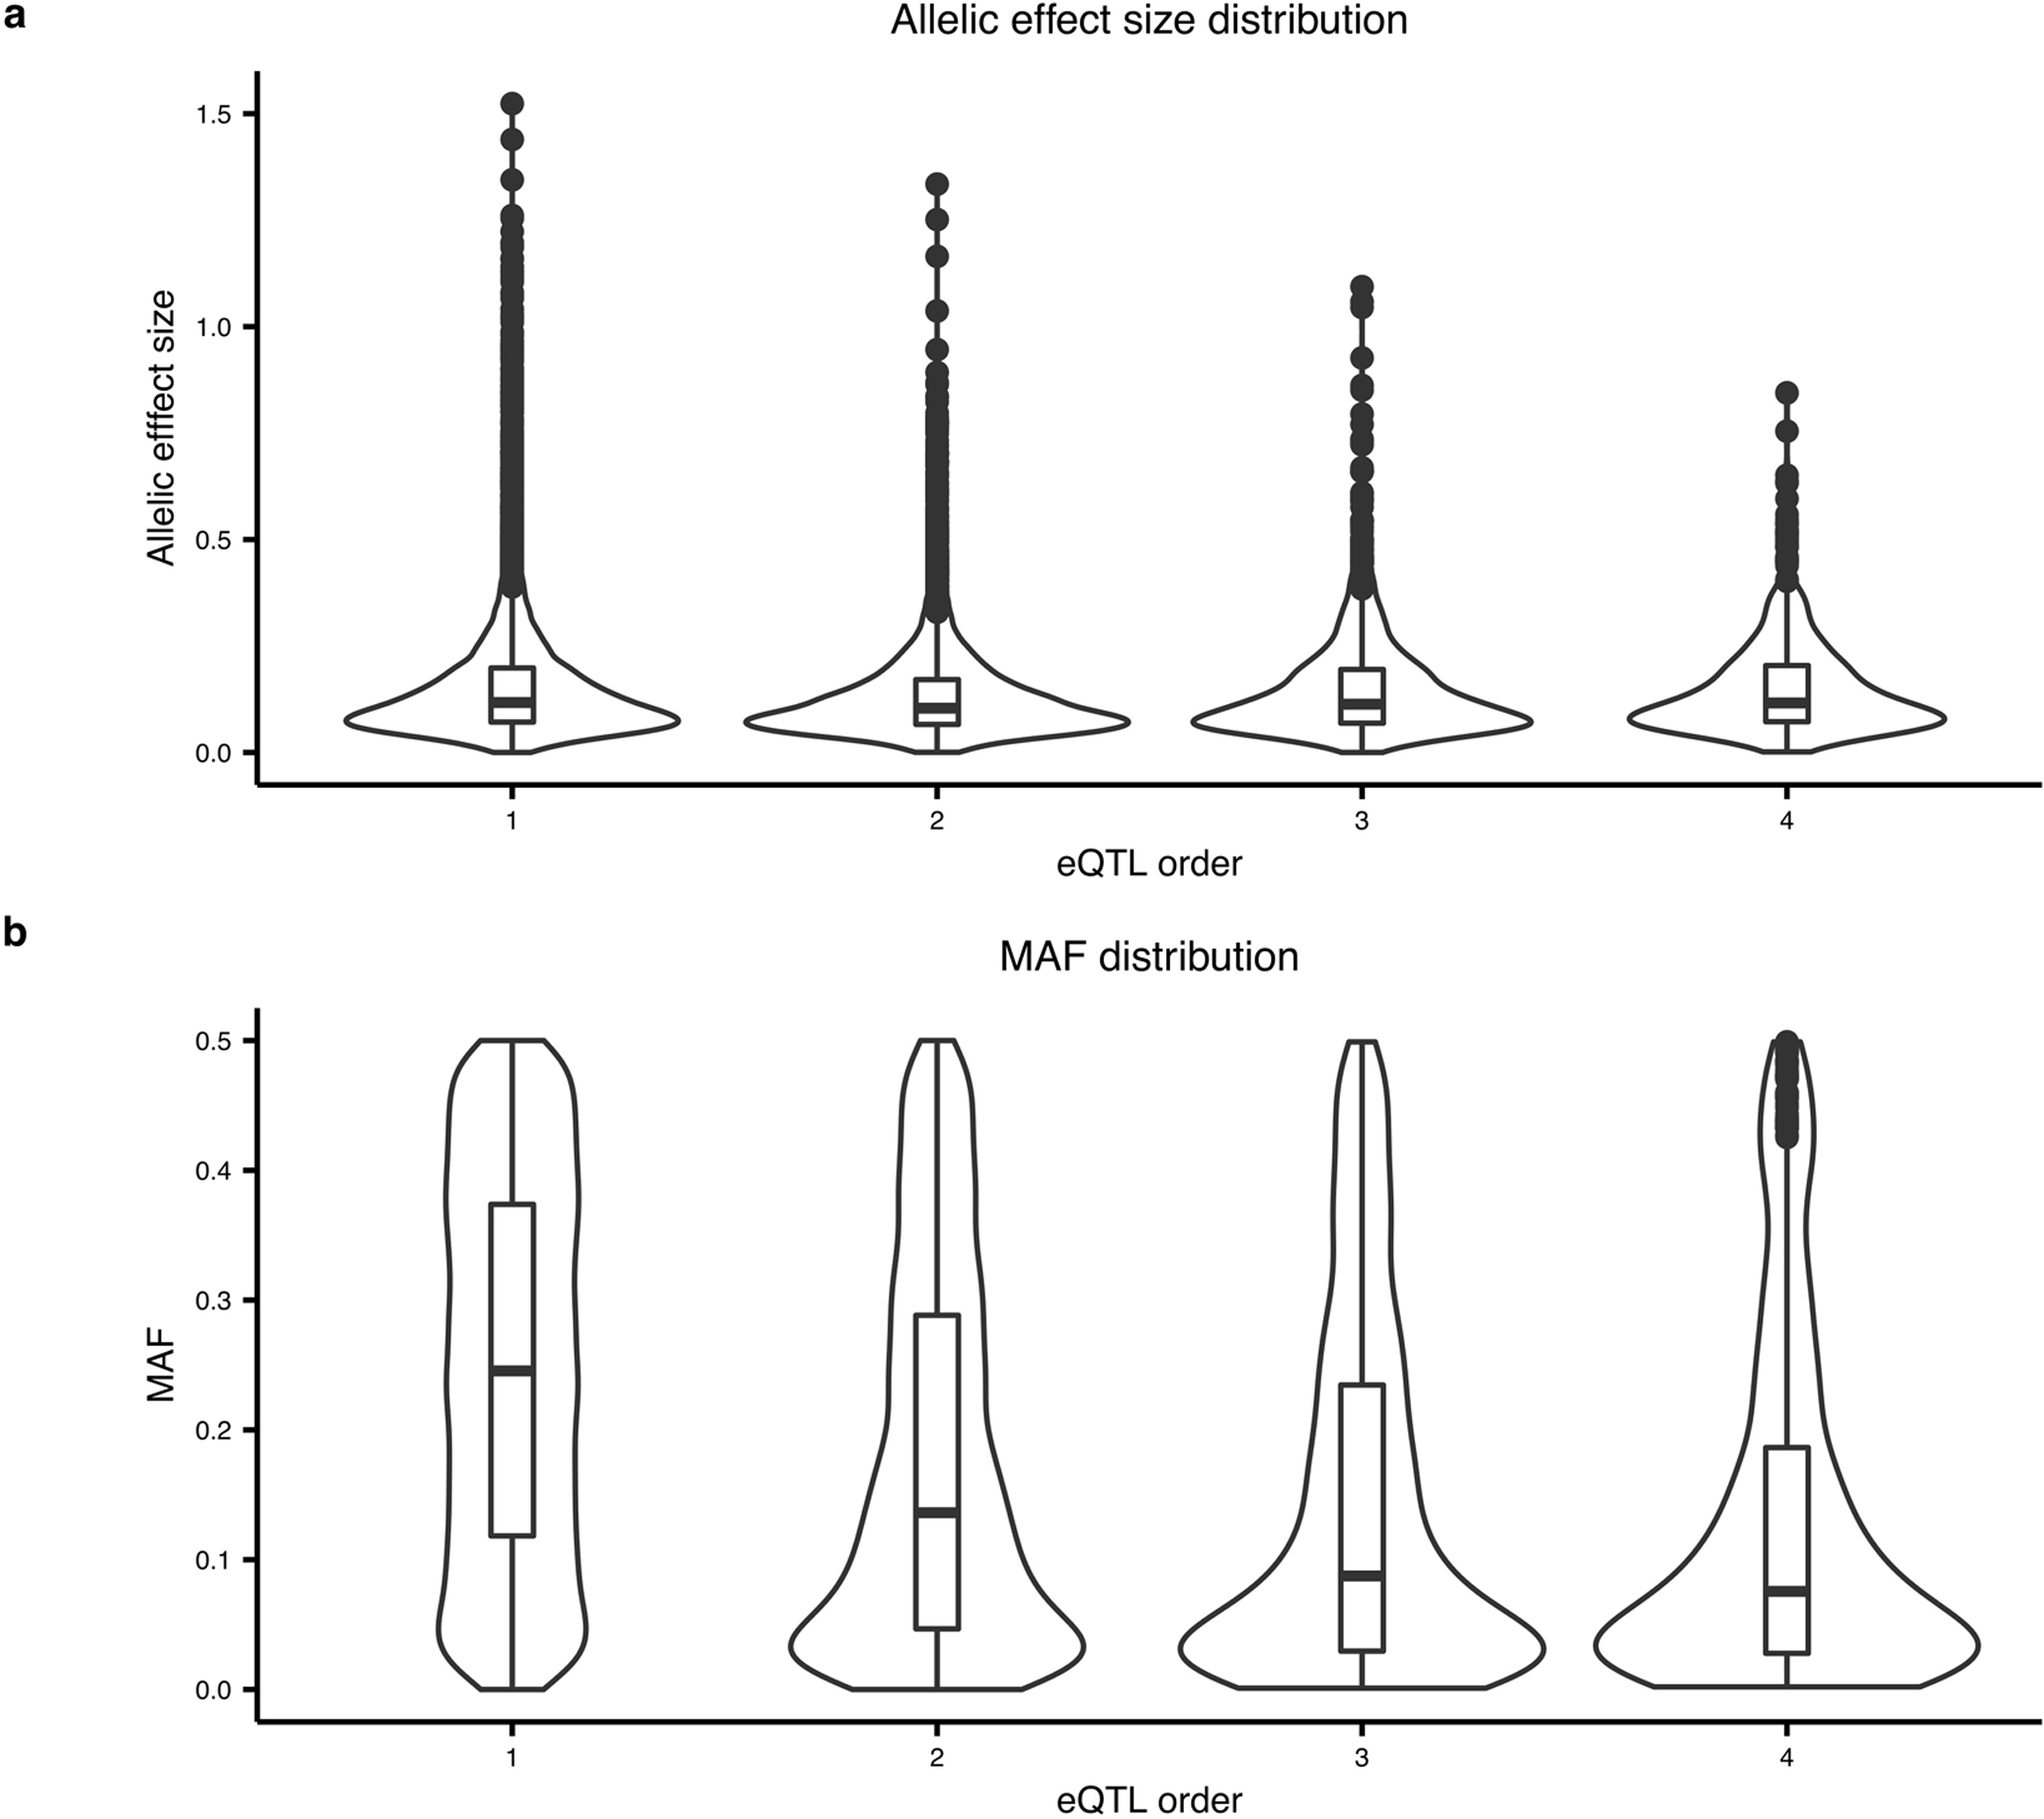
Extended Data Fig. 5. Estimated effect size and minor allele frequencies from conditional eQTL analysis.

The estimated effect size (A) and MAF (B) are shown for the lead eQTL SNP of significant genes for increasing order to conditional eQTL analysis. A) The distribution of estimated effect size is similar for all conditional analyses. B) The MAF shows a marked decrease with increasing order of conditional analysis. Box plot indicates median, interquartile range (IQR) and 1.5*IQR.
