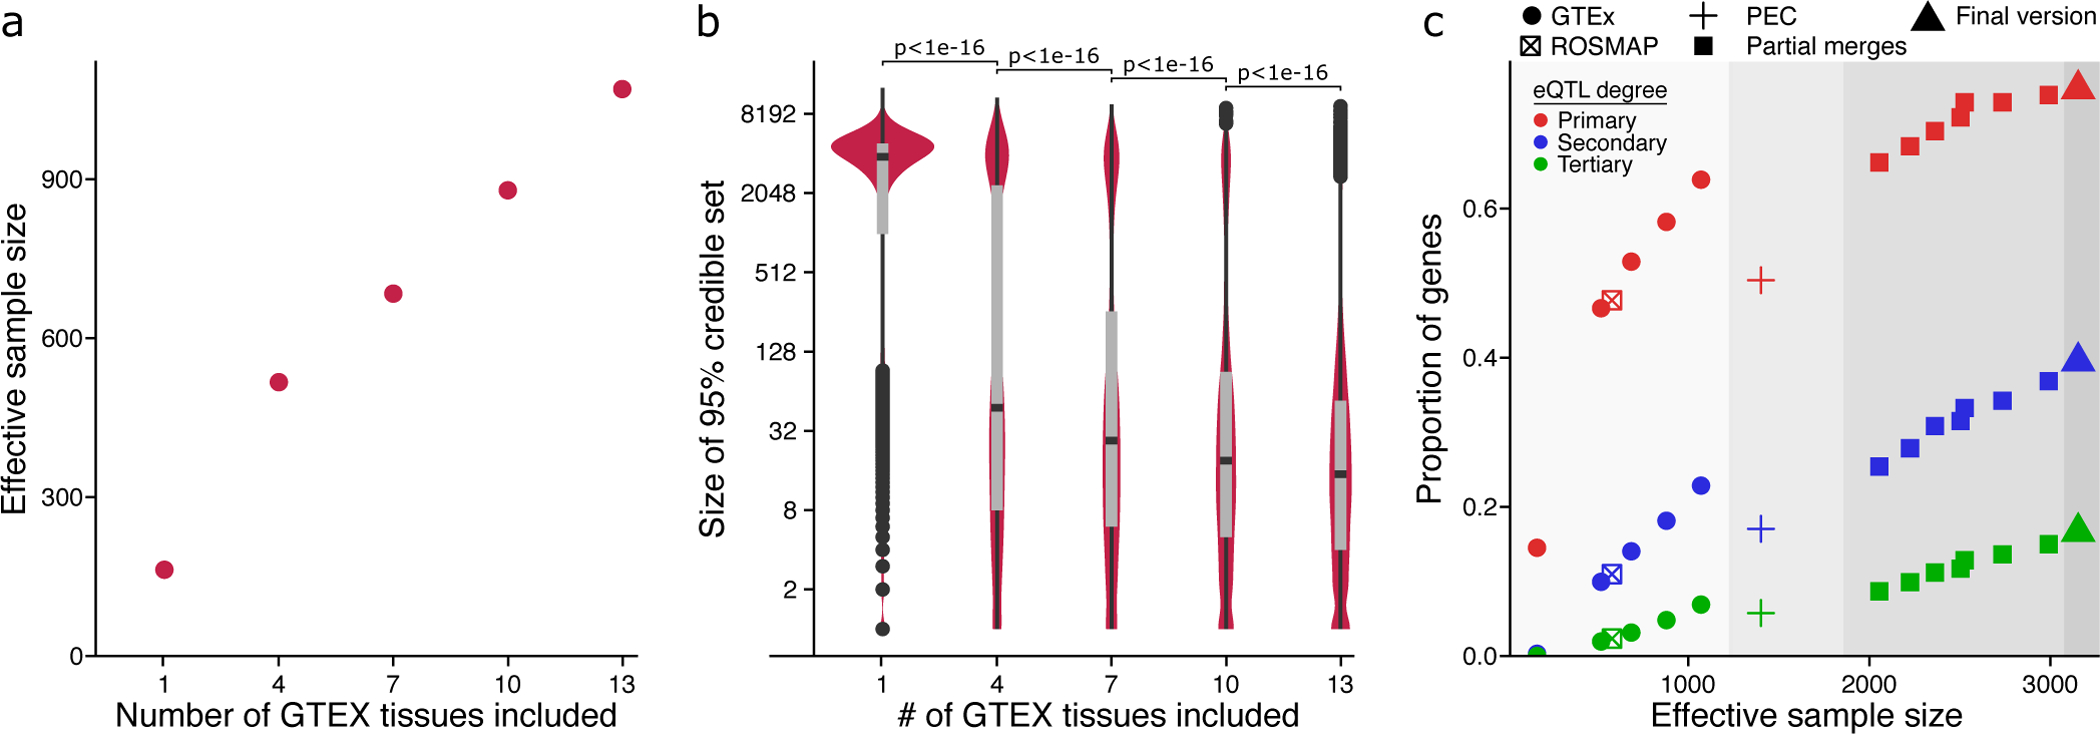
Figure 3: Evaluation of mmQTL workflow on real data.

A) Increasing the number of brain regions from GTEx increases the effective sample size. B) Increasing the number of brain regions from GTEx decreases the median 95% credible set size. P-values are shown from a one-sided Kolmogorov–Smirnov test between adjacent categories. Box plot indicates median, interquartile range (IQR) and 1.5*IQR. C) Including additional datasets increases the proportion of genes with a detectable primary or conditional eQTL. Colors indicate degree of eQTL. Panel is divided into regions showing 1) GTEx and ROSMAP results; 2) PsychENCODE (PEC) data analyzed here, and published PEC summary statistics15; 3) adding an increasing number of GTEx brain tissues to the PEC+ROSMAP results; 4) final version merging PEC+ROSMAP+GTEx.
