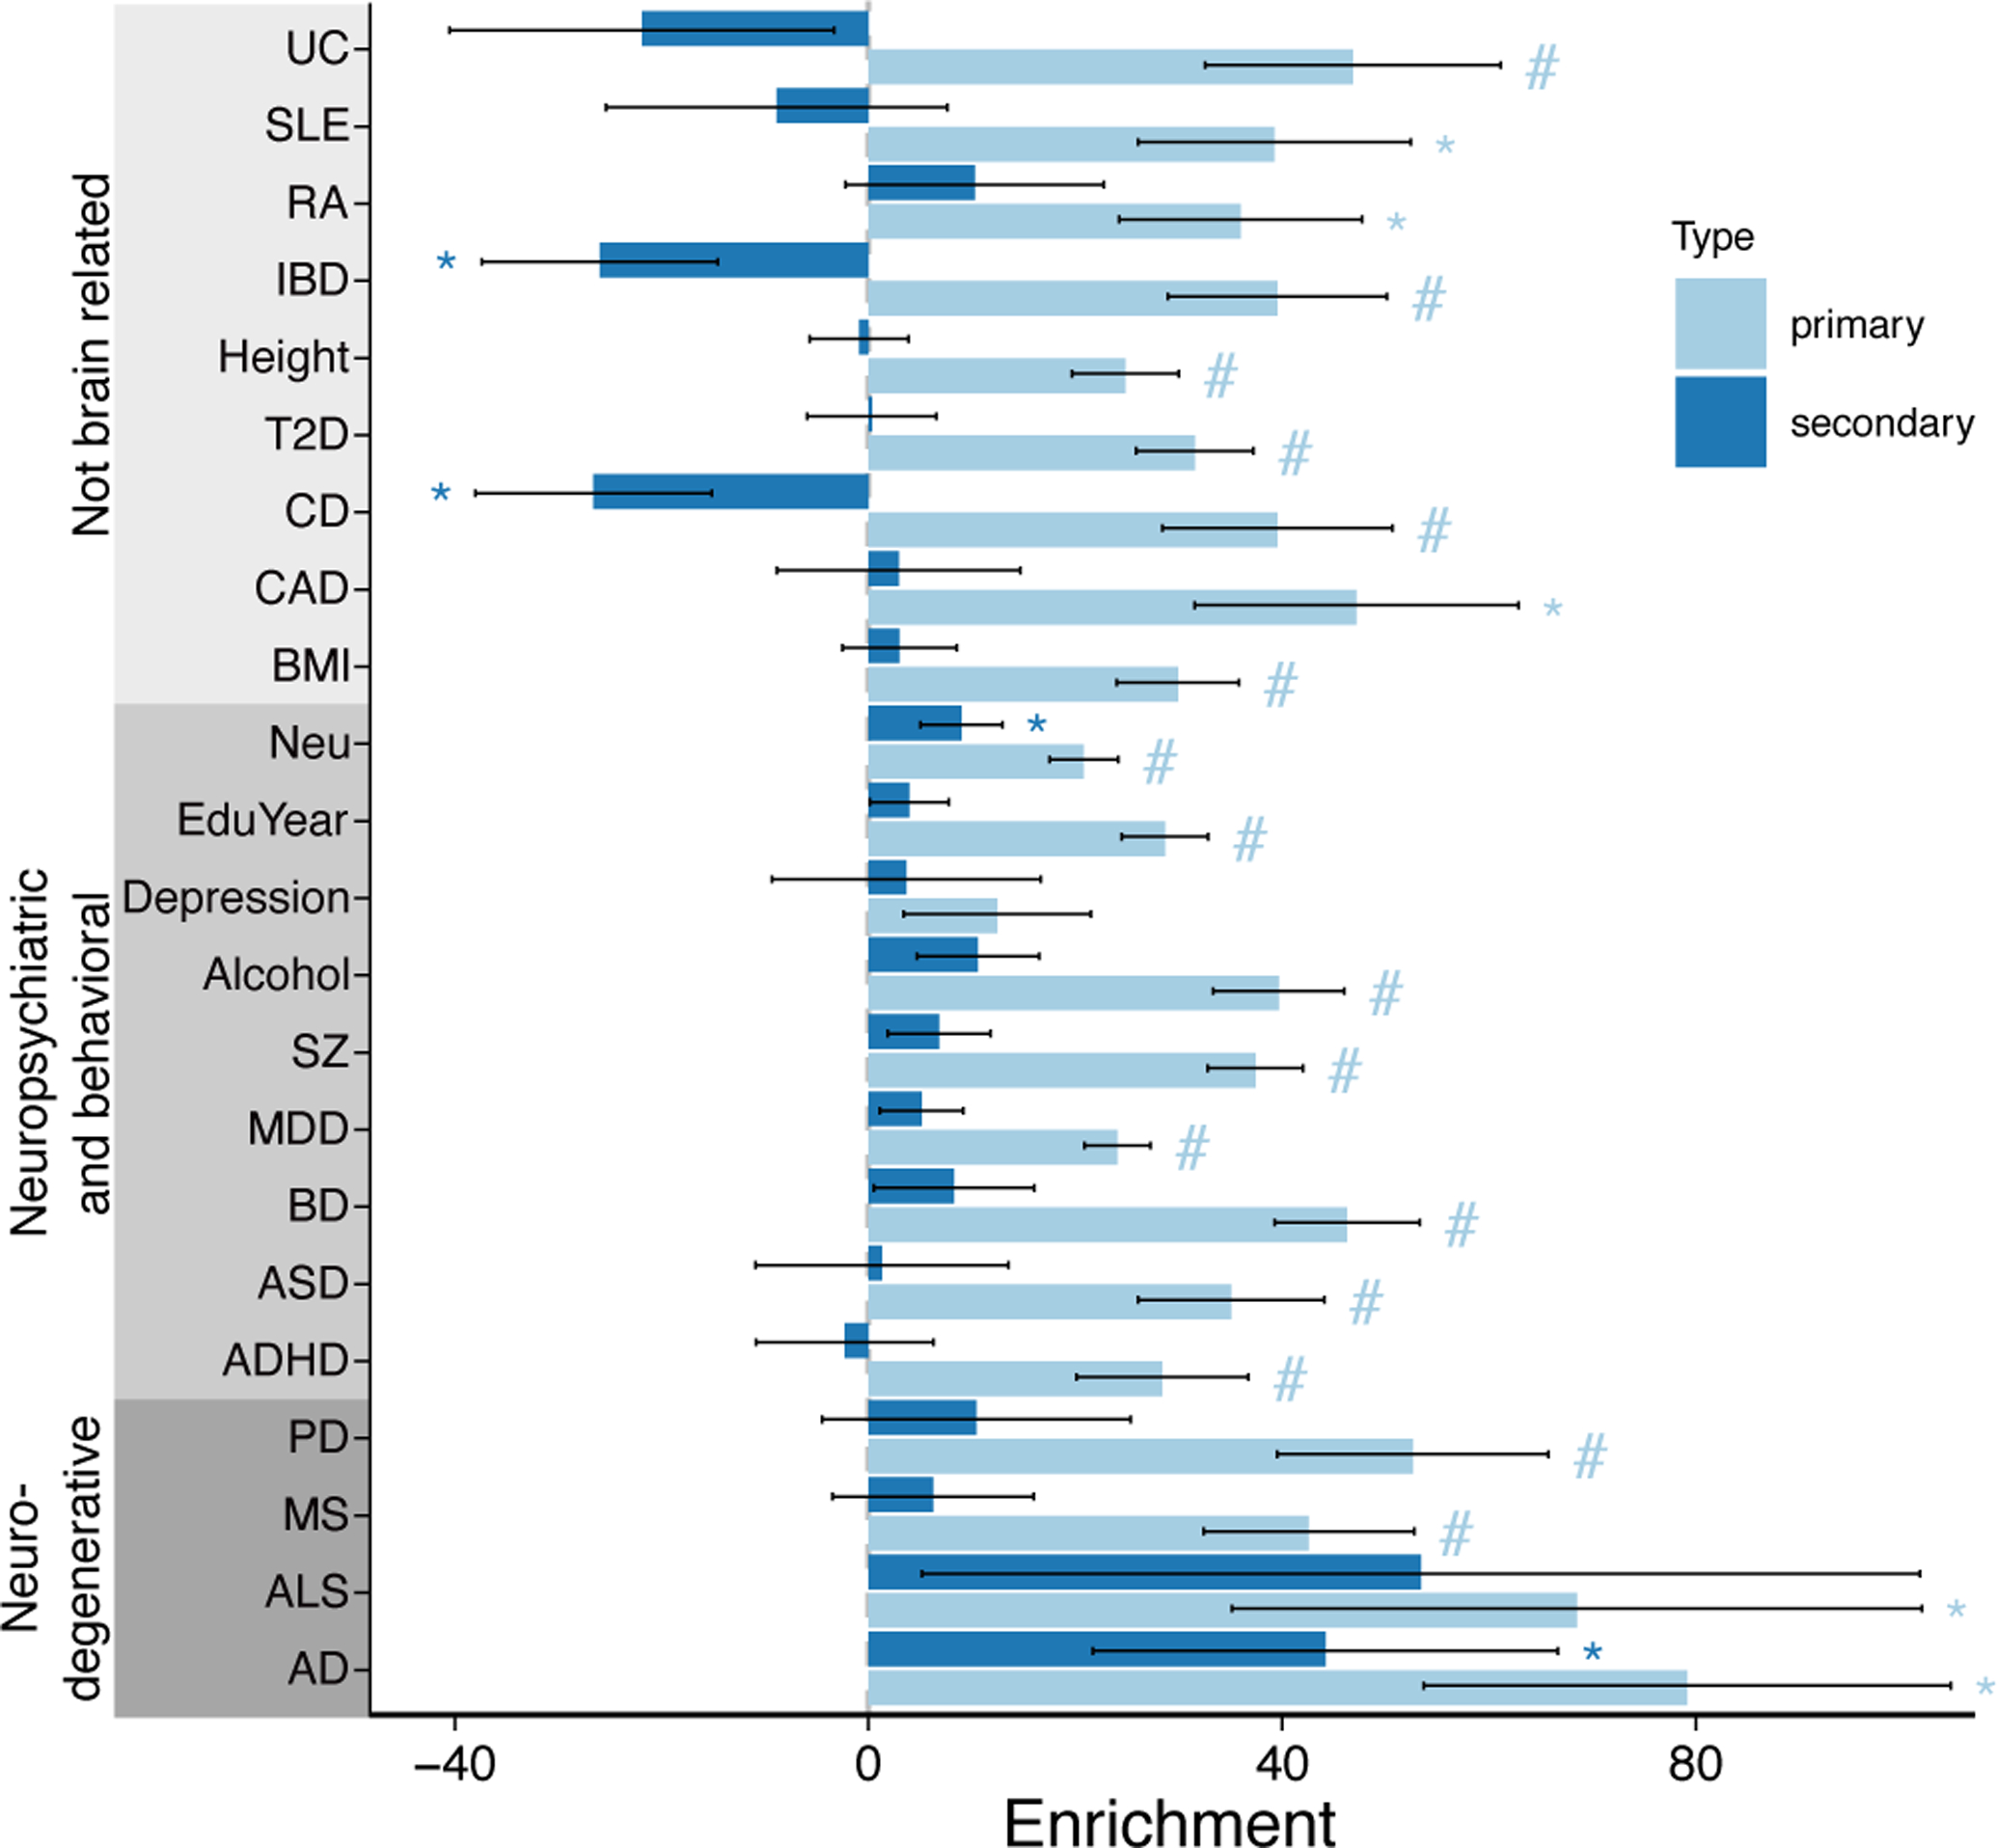
Figure 5. Heritability enrichment of variants in the 95% causal set for 22 complex traits.

Bar plot indicates linkage disequilibrium score regression (LDSC) enrichments for variants in the 95% causal set for primary and secondary eQTLs. Error bars indicate standard errors. ‘#’ indicates p-value passes 5% Bonferroni cutoff for 44 tests and ‘*’ indicates p-value < 0.05 from 2 sided one-sample z-test. See Supplementary Table 1 for trait abbreviations and references.
