
Figure 7: GWAS-eQTL colocalization by joint fine-mapping.
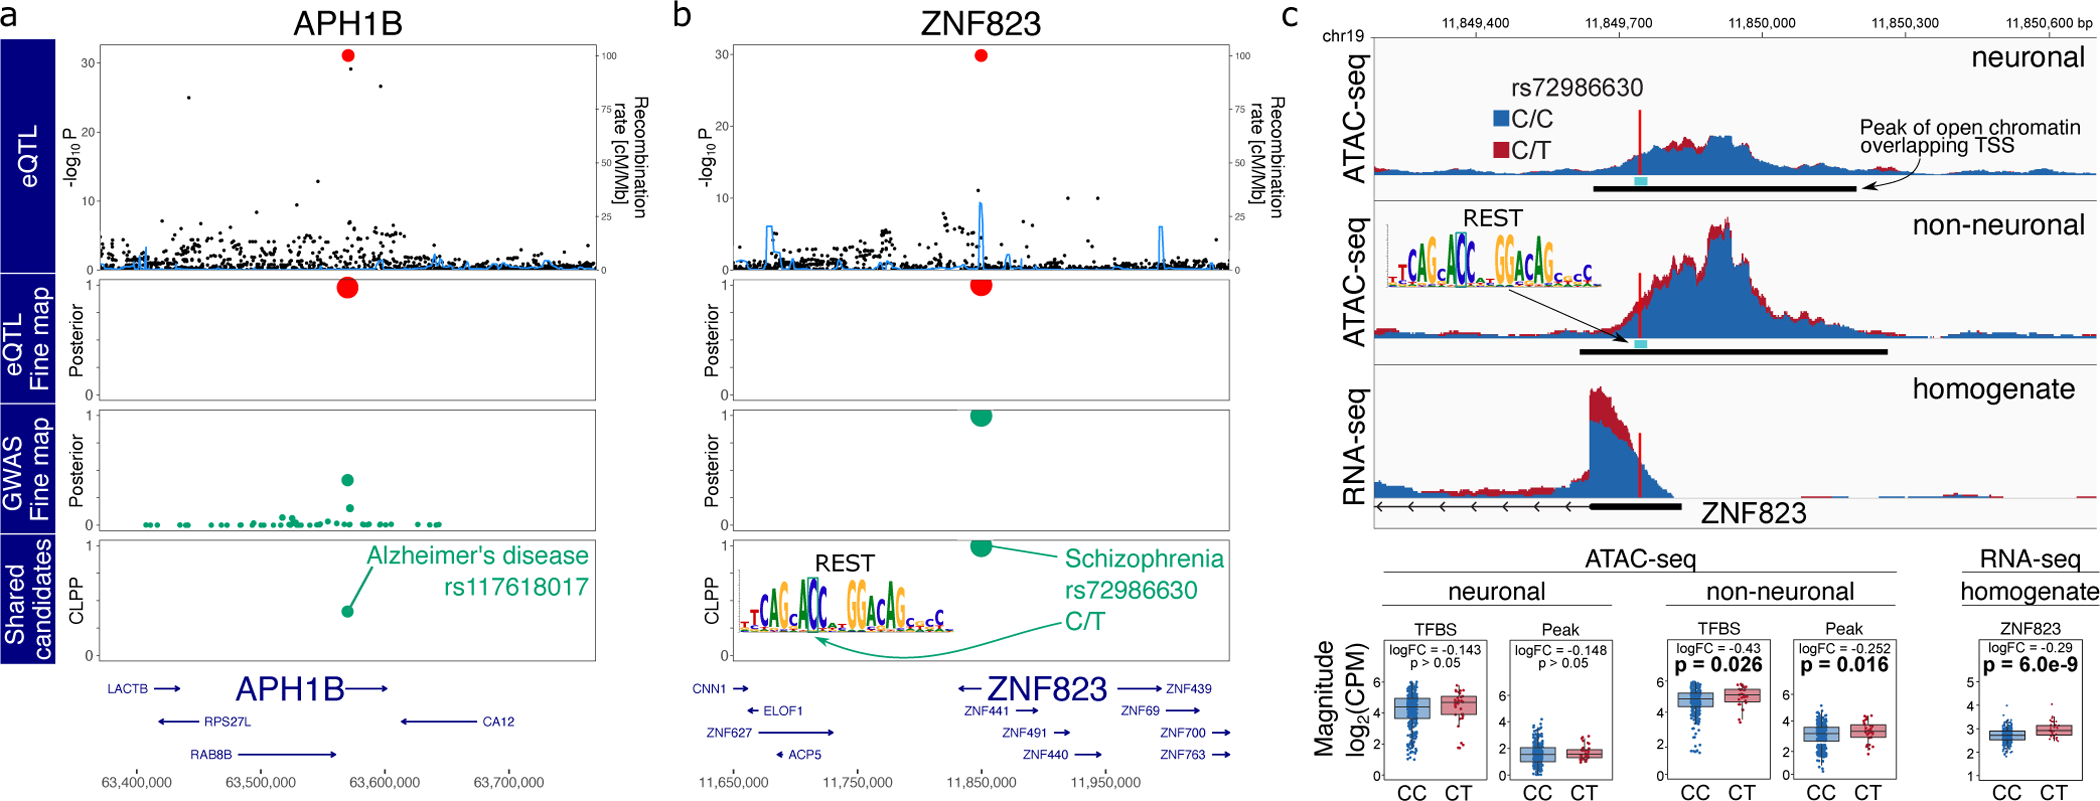
A,B) Starting from the top, the plot shows −log10 p-values from eQTL analysis, poster probabilities from statistical fine-mapping of eQTL results, poster probabilities from statistical fine-mapping of GWAS results, and colocalization posterior probabilities (CLPP) for combining eQTL and GWAS fine-mapping. A) Expression of APH1B and AD risk share rs117618017 as a candidate causal variant. B) Expression of ZNF823 and SZ risk share rs72986630 as a candidate causal variant. This variant is predicted to disrupt a REST binding site motif. C) Individuals heterozygous for rs72986630 have increased chromatin accessibility at the peak and REST binding site in non-neuronal cells. Genome-plot shows chromatin accessibility for neuronal (top) and non-neuronal (middle) nuclei, and gene expression from brain homogenate bottom. The lower panel shows boxplots comparing chromatin accessibility and gene expression between individuals with two reference alleles (i.e. CC) compared to CT heterozygotes. Box plots indicate median, interquartile range (IQR) and 1.5*IQR. Hypothesis tests were performed with limma/voom.