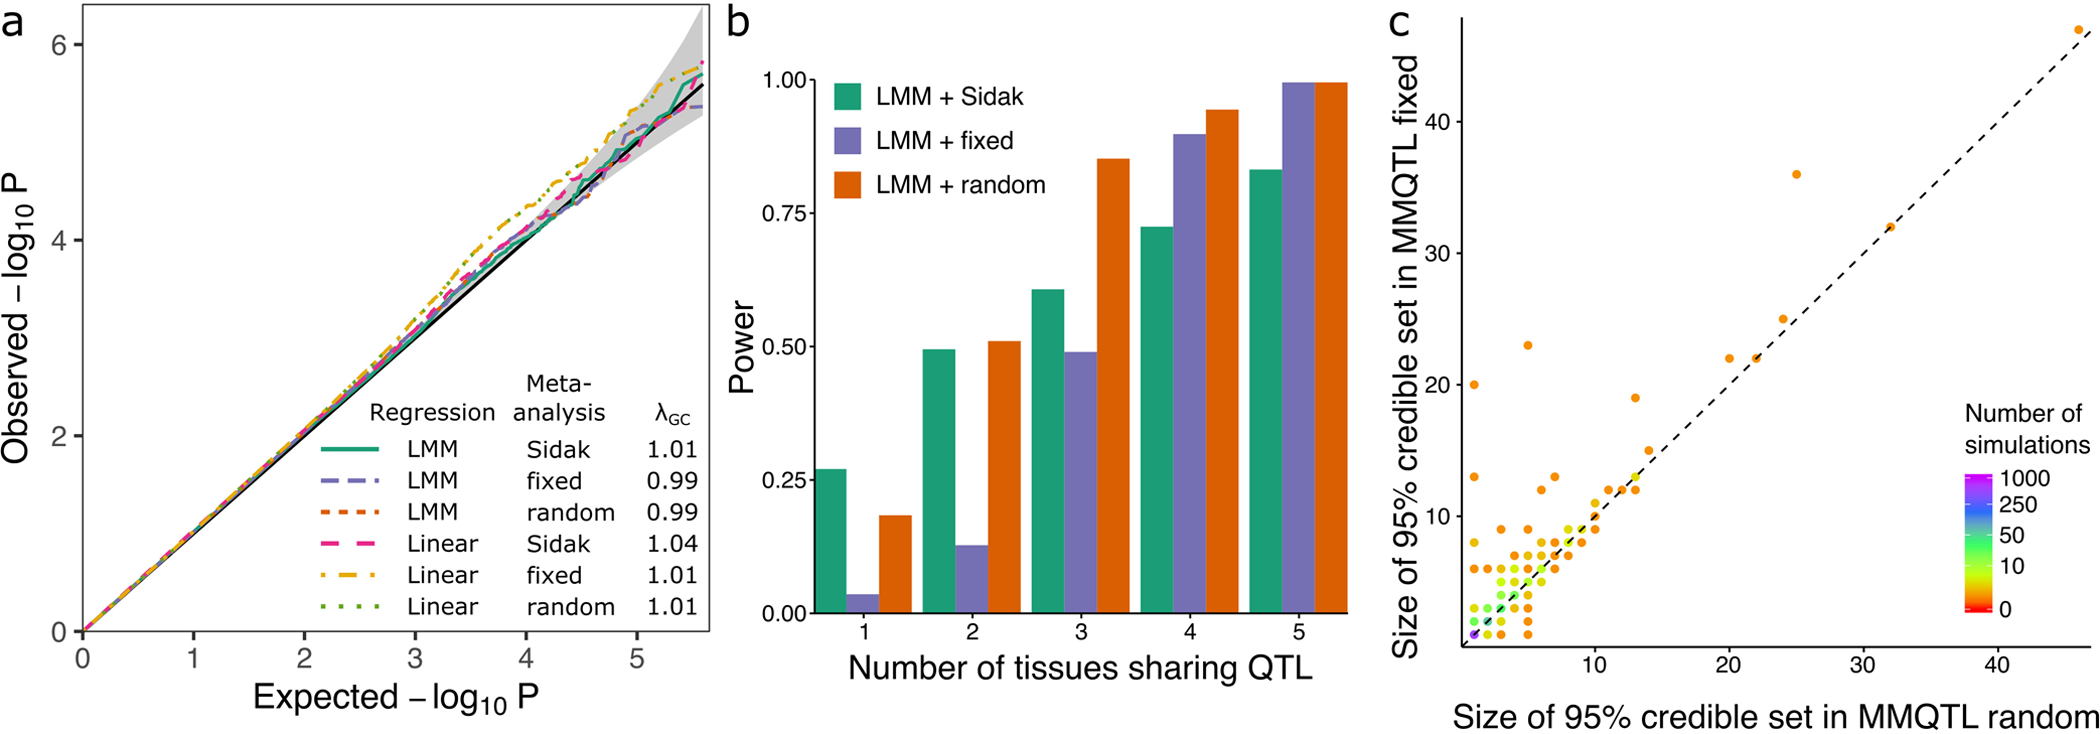
Extended Data Fig. 1. Biologically motivated simulations demonstrate performance of mmQTL workflow: low correlation scenario.

A) QQ plot of results from null simulation shows that the linear mixed model (LMM) with fixed or random effect meta-analysis accurately controls the false positive rate for, while linear regression with 5 genotype principal components did not. The Sidak method was very conservative in both cases. λGC indicates the genomic control inflation factor. Gray band indicates 95% confidence interval under the null. B) Power from LMM followed by 3 types of meta-analysis versus the number of tissues sharing an eQTL. C) Size of the 95% credible sets from fixed- (y-axis) and random- (x-axis) effects meta-analysis from simulations in Figure 2C.
