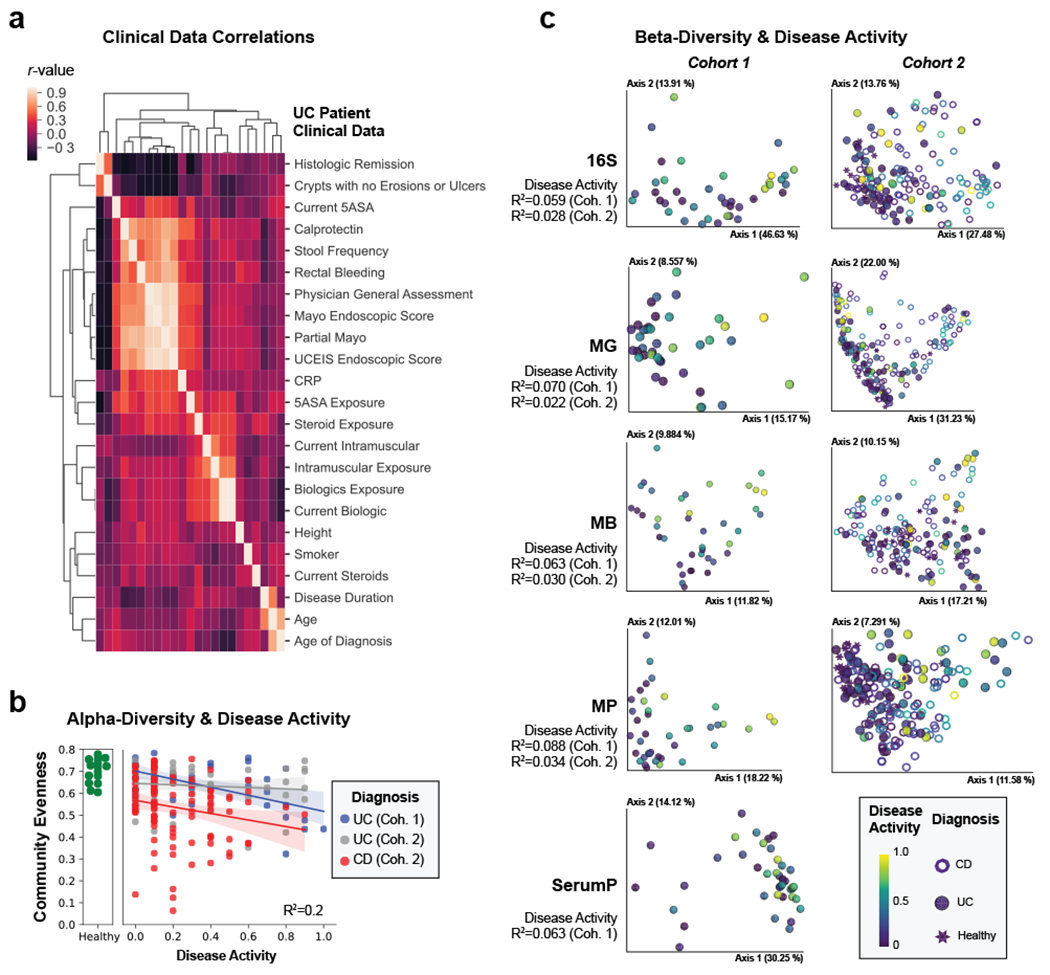
Figure 1. Multi-omic diversity correlates with IBD disease activity.

a, Heatmap of the correlation between clinical data. Hierarchical clustering was performed on spearman correlation values between each clinical metric for UC patients identifying groups of closely related clinical measurements. Each metric is represented in the same order on x- and y-axes and only y-axis labels are shown. b, Alpha-diversity decreases with active IBD. Pielou evenness based on 16S data is plotted for each patient with linear regression best-fit lines and 95% confidence intervals per patient group. An R2 value is indicated based on the disease activity, diagnosis and their interaction. c, Beta-diversity correlates with active IBD. Each collected -omic dataset is displayed by a principal coordinate analysis showing the first two axes. Each sample is colored by the disease activity state and has a shape corresponding to diagnosis. Adonis R2 values are shown to demonstrate the effect size of disease activity when accounting for disease activity, diagnosis and their interaction. Distance matrices best separating disease activity are displayed. Distance matrices shown are weighted UniFrac for each dataset other than proteomic datasets, which use the Bray-Curtis distance metric, and the metagenome of UC cohort 1 which uses unweighted UniFrac.
