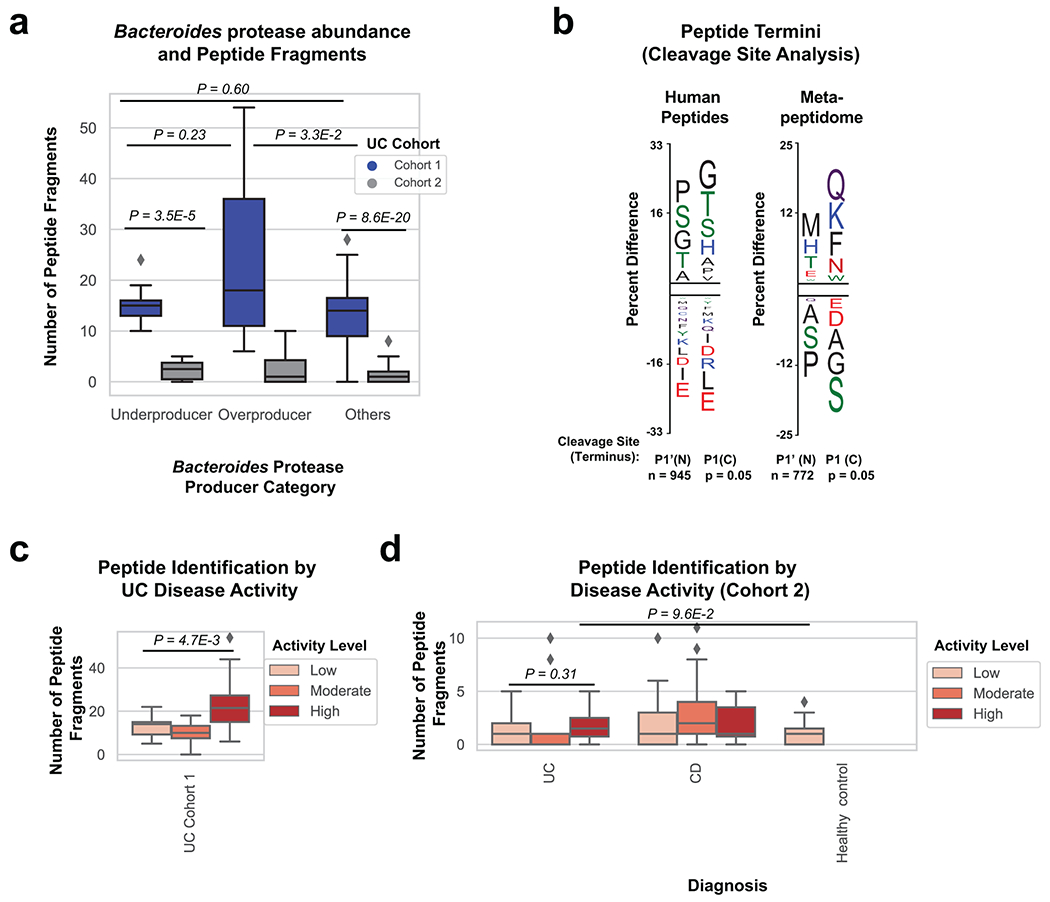
Extended Data Fig. 7. Peptide fragments are increased in active UC patients and Bacteroides protease enriched patients.

a, Comparison of peptide fragments identified in patients with varying abundance of Bacteroides proteases. Overproducers from UC cohort 1 had increased peptide fragments in comparison to other patients (Two-tailed t-test P=3.5E-2). Data was derived from n=8, 9, 23 UC cohort 1 samples and n=6, 6, 49 UC cohort 2 samples from patients classified as underproducer, overproducer and other respectively. b, Peptide termini indicate unique proteolysis of human and microbial proteins. The frequency of each amino acid within the N and C terminus of human and de-novo peptides was compared to either the human proteome or the total amino acid content of de novo peptides. The Y-axis represents the percent difference of each residue and the letter indicates the amino acid associated with the difference. The N and C terminus are shown separately and each residue is colored by chemical property (Green = polar, Black = Hydrophobic, Red = Acidic, Blue = Basic, Purple = Neutral). c, Peptide fragment identification comparison by disease activity in UC cohort 1. Boxplots with a two-tailed t-test p-value is shown (P=4.7E-3). Data was derived from n=18, 12, 10 patient samples with low moderate or high disease activity respectively. d, Peptide fragment identification comparison by disease and disease activity state for cohort 2 samples. Boxplots are shown with overlaid two-tailed t-test p-values. Data was derived from n=19 healthy controls, n=39, 30, 12 UC samples, and n=64, 30, 8 CD samples from patients of low, moderate and high activity respectively. Boxplots in (a,c,d) are defined by the median, quartiles and 1.5x inter-quartile range.
