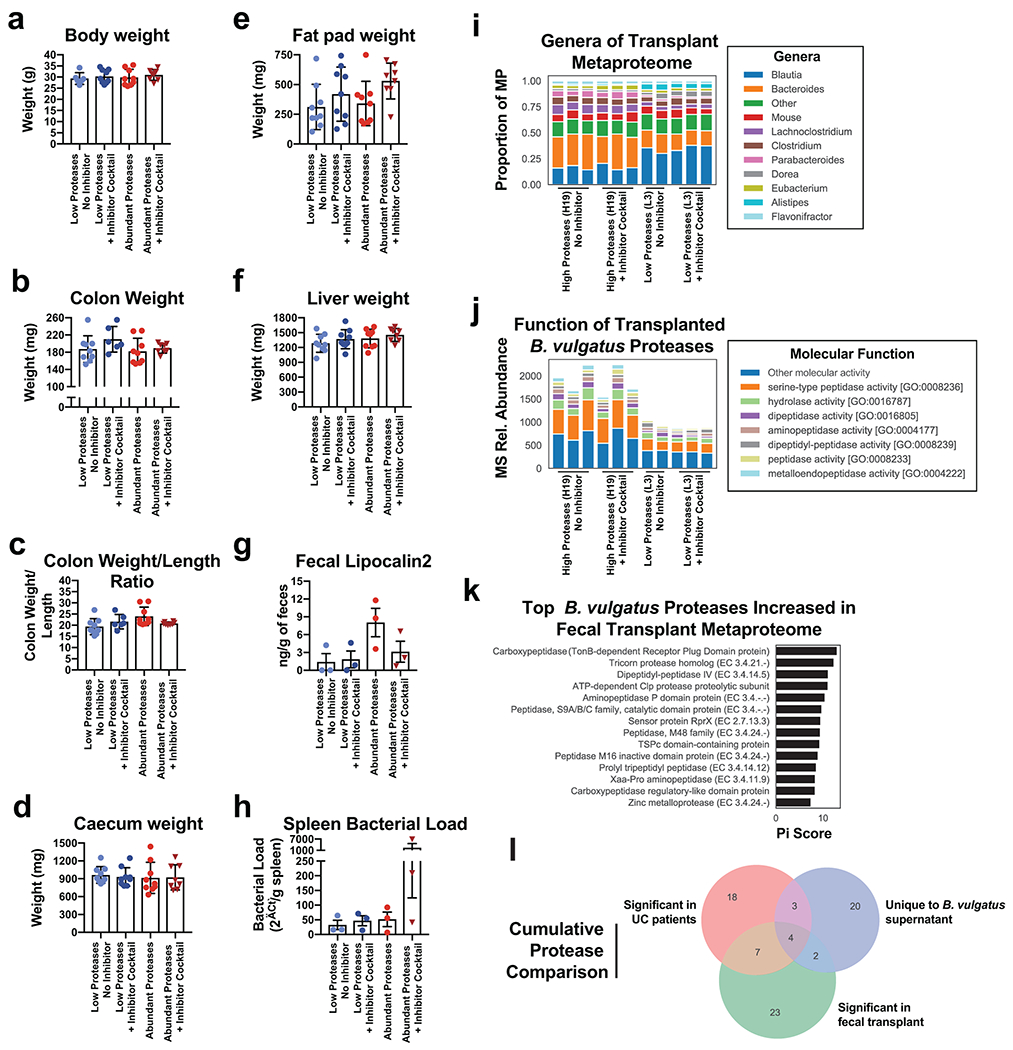
Extended Data Fig. 9. Additional measurements from fecal transplant experiments.

a-f Barplots showing the mean +/− SD of macroscopic organ measurements from fecal transplant of UC patients samples in IL10−/− mice with or without administration of a protease inhibitor. Dots represent one mouse, with each group representing results from 3 UC patient fecal samples with each sample given to 3 co-housed mice. Measurements include final weight of the mice (a), colon weight (b), ratios of the colon weight to length (c), caecum weight (d), fat pad weight (e), liver weight (f). g-h Barplots showing the mean +/− SEM for the concentration of an intestinal inflammatory marker, fecal lipocalin2 (g), and amount of 16S rRNA in the spleen of mice for an estimate of the splenic bacterial load (h). Each dot in g-h represents the mean of n=3 mice transplanted with the same UC fecal sample (with the exception of a mean from n=2 mice for one patient sample in the Abundant Proteases + Inhibitor Cocktail group) from n=2 independent experiments. i, Metaproteome genera composition of mice transplanted with UC fecal samples. Fecal samples taken at 8-weeks from mice transplanted with one high protease containing sample (H19) and one control patient sample (L3) were analyzed by mass spectrometry based metaproteomics. Stacked barplots are shown for each mouse displaying the proportion of protein signal derived from the most common genera. j, Molecular function of B. vulgatus proteases identified in mice receiving UC fecal samples. The relative abundance of each B. vulgatus protease is shown in stacked barplots grouped by the Gene Ontology molecular function associated with each protein. k, Top B. vulgatus or B. dorei proteases associated with the fecal samples of mice receiving the H19 sample. Each protein is ranked by pi-score, which combines two-sided t-test p-values and the fold-change difference between all H19 and L3 samples. l, Cumulative protease comparisons. A venndiagram is shown comparing the protein names of B. vulgatus or B. dorei proteases from four independent proteomics experiments performed in this study. A full list of the Bacteroides proteases identified in this analysis can be found in Supplementary Table 4.
