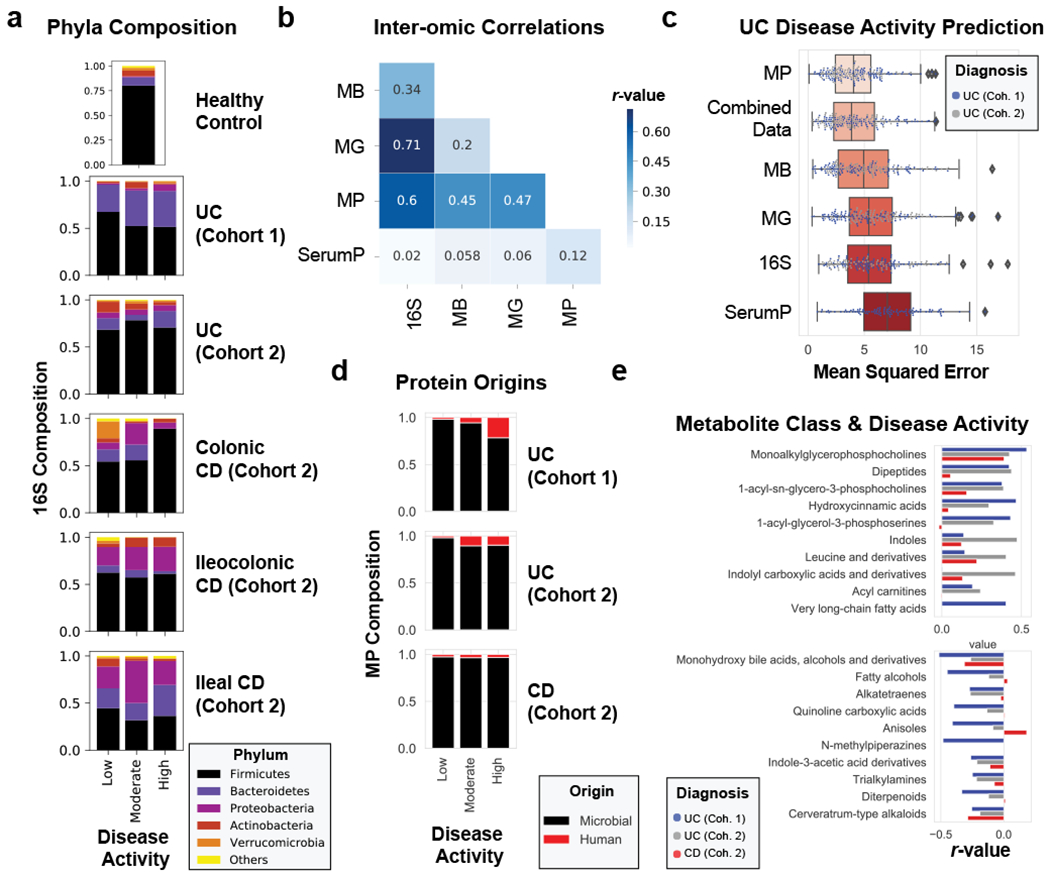
Figure 2. Multi-omic analysis of IBD disease activity.

a, 16S phyla composition by disease activity states. The average phyla compositions of groups of patient samples are shown in bar plots. Barplots represent sample sizes of n=18, 12, 10 for UC Cohort 1; n=34, 9, 13 for UC Cohort 2; n=19, 8, 1 for Colonic CD; n=22, 7, 3 for Ileocolonic CD; n=19, 4, 2 for Ileal CD (each ordered low, moderate, high activity respectively); n=15 samples for healthy controls. b, Data type correlations. Pearson correlations between data types are displayed in a heat map. The Bray-Curtis distance metric was used for all data types and correlations were performed on distance matrices through Mantel’s test. c, Evaluating meta –omic performance in predicting UC disease activity. The mean squared error from n=100 iterations of random forest analyses on each UC cohort trained to predict the partial Mayo disease activity (ranging from 0-9) are displayed in boxplots ordered from the strongest predictive capability (metaproteome) to the least predictive capability (serum proteome). d, Metaproteome composition by disease activity states. The relative abundances of human and microbial proteins were averaged by disease activity states and plotted by different patient categories. Barplots represent sample sizes of n=18, 12, 10 for UC Cohort 1; n=38, 11, 14 for UC Cohort 2; n=66, 31, 9 for CD (each ordered low, moderate, high activity respectively). e, Top metabolite classes correlated with UC disease activity. Metabolite abundances summed by chemical class were averaged and linear regressions were performed to disease activity. The r-values of the top 10 positively and negatively correlated classes of chemicals are plotted by diagnosis and cohort, and displayed in order of the summed r-values from UC cohorts. Boxplots in (c) are defined by the median, quartiles and 1.5x inter-quartile range.
