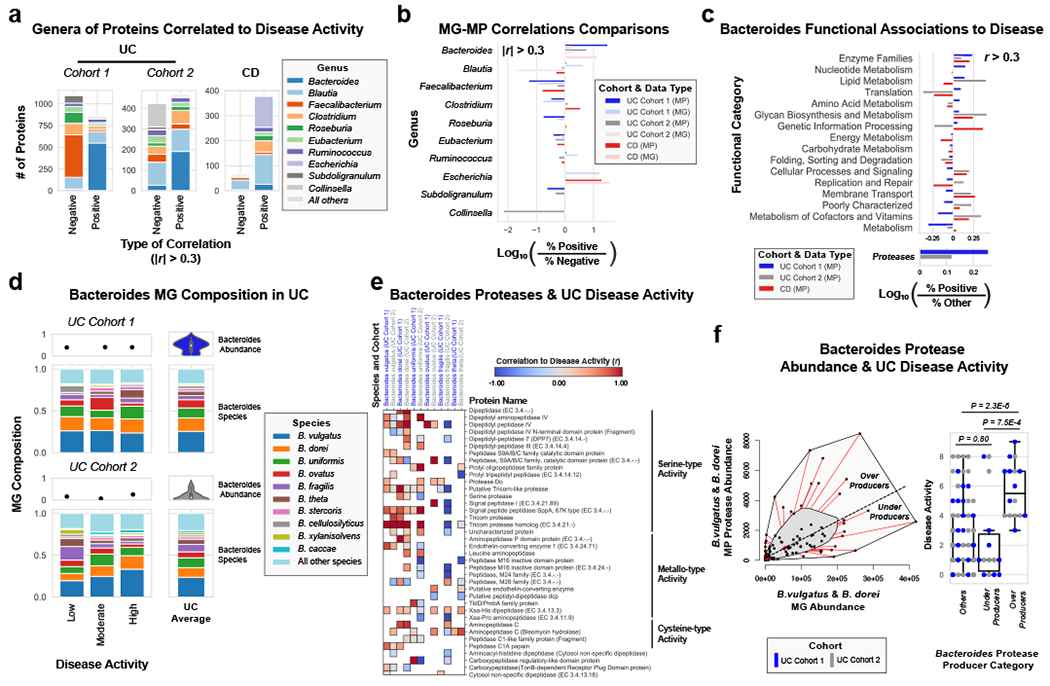
Figure 3. Integrated metagenomic-metaproteomic analyses reveal Bacteroides proteases distinguishing a subset of active UC patients.

a, Taxonomic biases among proteins correlated to disease activity. Linear regressions against disease activity were performed for each protein quantified and the taxonomic origins of all highly associated proteins (Pearson’s r > 0.3 or r < −0.3) are plotted per patient cohort. b, Comparison of biases in the taxonomic origins of highly associated microbial open-reading frames at the MG or MP level. Linear regressions were performed as in (a), and the percent representation of taxa in positive correlations (r > 0.3) and negative correlations (r < −0.3) are plotted by Log10 transformation. c, Functional shifts in Bacteroides during active IBD. The Bacteroides proteins associated with disease activity (r > 0.3) from (a) were compared to remaining identified Bacteroides proteins to identify putative functional shifts related to UC disease activity. d, Species-level investigation of Bacteroides in MG of UC patients. Bacteroides species composition plots are shown for categories of UC disease activity, as well as the average within each cohort. Above each composition plot are dot plots indicating the average abundance of Bacteroides reads in the MG, or a violin plot showing the kernel density estimate of the general distribution in the UC cohort. Data was compiled from sample sizes of n=18, 12, 10 for UC Cohort 1 and n=38, 13, 13 for UC Cohort 2 (each ordered low, moderate, high activity respectively). e, Correlation of Bacteroides proteases and enzymes to UC disease activity. The species level annotation of proteases identified in different Bacteroides species was compared in a heatmap showing the correlations of each enzyme to UC activity per species. f, Patients with Bacteroides protease overproduction correlates with increased disease activity. An outlier approach comparing B. vulgatus and B. dorei metagenomic abundance to the summed protein abundances from B. vulgatus and B. dorei proteases was taken to identify groups of UC patients with higher or lower than metagenomically expected protease presence. A bagplot is shown with a best-fit line and over or under-producer status was determined by outlier status above or below the best-fit line. The disease activity of overproducers, underproducers, and other UC patients are individually plotted over boxplots. Two-tailed, t-test p-values are displayed above the boxplots. Sample sizes include n=16, 14 and 77 for Over Producers, Under Producers and Others respectively. Boxplots are defined by the median, quartiles and 1.5x inter-quartile range.
