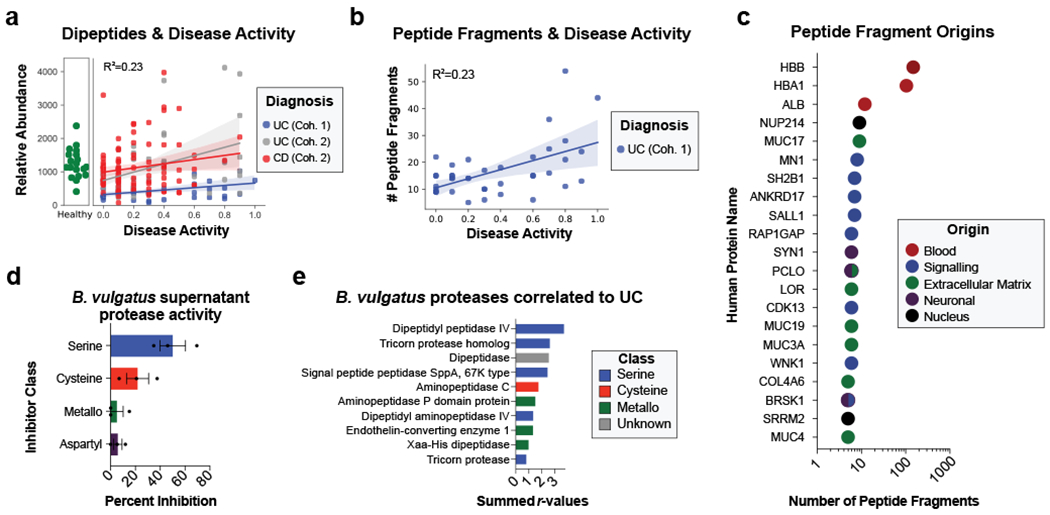
Figure 4. Assessing proteolysis in UC patients and Bacteroides supernatant.

a, Abundances of dipeptides increases with disease activity. The average relative abundance of metabolomic features annotated as dipeptides per sample is plotted according to disease activity with linear regression best-fit lines and 95% confidence intervals shown per patient cohort. b, Peptide fragments are more abundant during active UC. The number of peptides identified through a de-novo peptidomic workflow is plotted alongside UC disease activity. The linear regression best-fit line with a 95% confidence interval is shown for UC cohort 1. c, The number of peptide fragments from human proteins indicates potential targets of UC proteolysis. The gene symbol for the human proteins with the most number of short peptides present are shown on the y-axis and the quantity of peptides is shown on a log10 transformed x-axis. The proteins are colored by common categories of the observed proteins. d, Class of protease activity in B. vulgatus supernatant. Concentrated supernatant from overnight cultures of B. vulgatus was subjected to a protease activity assay in the presence of different classes of protease inhibitors. Vehicle controls were used to determine the percent inhibition from each inhibitor and the mean +/− SEM from n=11 wells per-condition from n=3 independent experiments are displayed. Protease inhibitors included 10 mM AEBSF (Serine), 100 μM E-64 (Cysteine), 2.5 mM GM6001 (Metallo) and 180 μM Pepstatin A (Aspartyl). e, Ranking of B. vulgatus proteases by summed correlations to UC disease activity. The correlation values (r) between UC disease activity and B. vulgatus and B. dorei proteases were summed. The sums from the top-10 ranked proteases are shown with the colors of each bar representing protease class.
