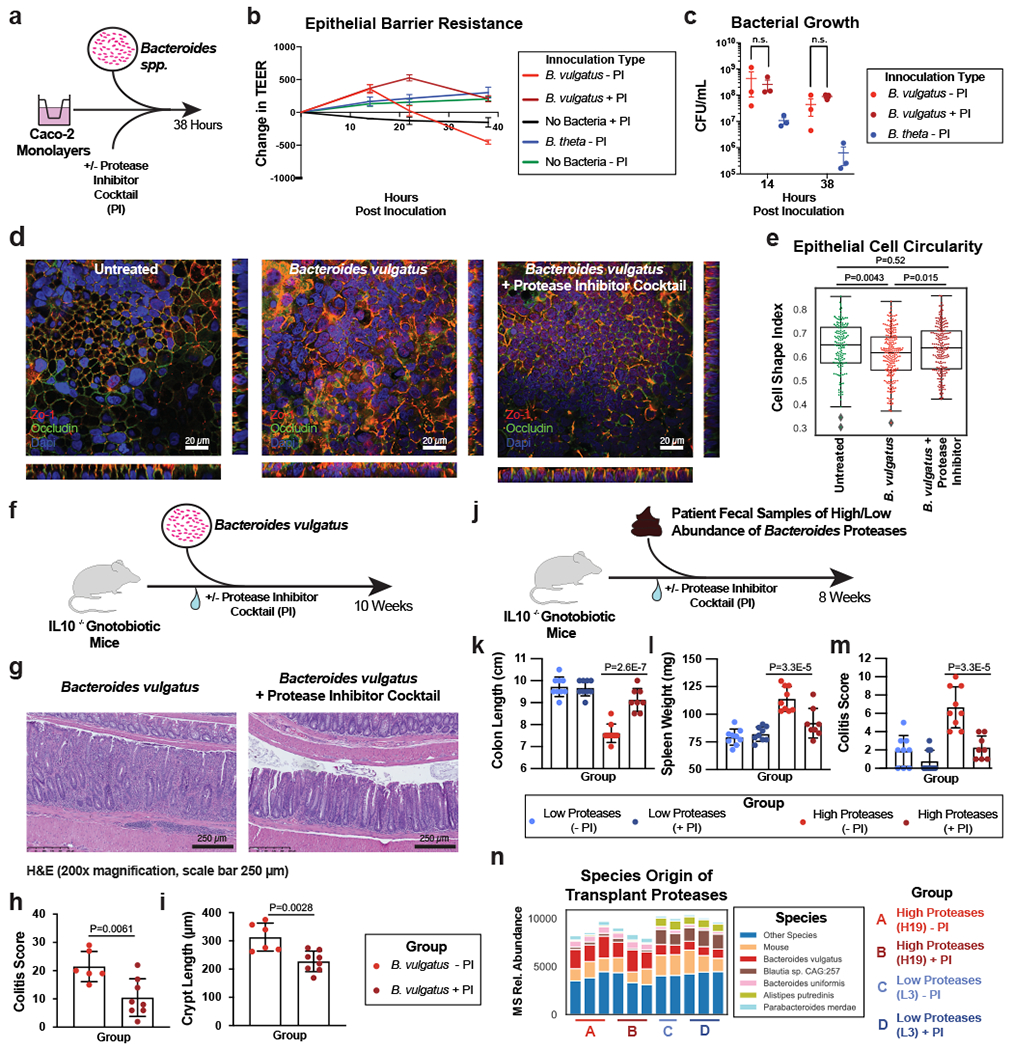
Figure 5. Protease inhibition protects from Bacteroides vulgatus and fecal transplant induced pathology in vitro and in vivo.

a, Schematic describing the in vitro studies using Caco-2 cell monolayers and Bacteroides spp. b, Protease inhibition significantly restores the Caco-2 epithelial barrier when co-cultured with B. vulgatus. A timeseries of the change in transepithelial electrical resistance (TEER) is plotted with the mean and standard error of the mean (SEM). c, Protease inhibitor cocktail does not significantly influence the number of CFUs during Caco-2 co-culturing with B. vulgatus. Plotted are the mean CFUs +/− SEM from each independent experiment. Two-way ANOVA adjusted for multiple comparisons performed at 14 hours (P=0.69) and 38 hours (P=0.97). Data from (b, c) derived from n=3 independent experiments containing n=3 biological replicates per condition. d, Representative images from confocal microscopy of the transwell experiments. A representative image from untreated, B. vulgatus, and B. vulgatus with a protease inhibitor cocktail are shown. Immunofluorescence of tight junction proteins, Zo-1 and Occludin along with dapi are shown. Below and to the right of each image are the XZ and YZ slices. Scale bars are 20 μm. e, Quantification of cell circularity in the images from panel d. Two-tailed t-test p-values are shown between groups. Statistics were derived from n=151, 221, 198 untreated, B. vulgatus - PI and B. vulgatus + PI cells examined over 1 independent experiment. Boxplots are defined by the median, quartiles and 1.5x inter-quartile range. f, Experimental design of monocolonized IL10−/− mouse study. Mice were inoculated with B. vulgatus. During 10-weeks of colonization, a protease inhibitor cocktail was continuously administered through the drinking water of B. vulgatus mice. g, Representative H&E-stained colon sections of monocolonized mice with a 250 μm scale bar for scale. h, Colitis scores from histological assessment of monocolonized mice. Between group two-tailed t-test P=0.0061. i, Crypt lengths of monocolonized mice. Between group two-tailed t-test P=0.0028. Data from h-j displayed as barplots with mean values +/− SD from n=6 animals for B. vulgatus - PI and n=8 B. vulgatus + PI groups conducted in n=2 independent experiments. j, Experimental design of humanized IL10−/− mouse study. A total of n=9 animals per group (with the exception of n=8 mice for High Proteases + PI group) representing n=3 UC patient samples per group were examined over 2 independent experiments. k-m Protease inhibition improves colitis measurements induced by UC stool. Barplots showing the mean +/− SD are shown with overlaid p-values from one-way ANOVA adjusted for multiple comparisons between groups are for colon length (P=2.6E-7) (k), spleen weight (P=3.3E-5) (l) and histopathological scoring of colonic sections (P=3.3E-5) (m). n, Species representation of proteases in the fecal metaproteome of humanized mice. The fecal samples from one group of humanized mice with abundant Bacteroides proteases and one group without abundant proteases was subjected to LC-MS3 based metaproteomics. The relative abundance from identified proteases is shown based on the species annotation of each protease.
