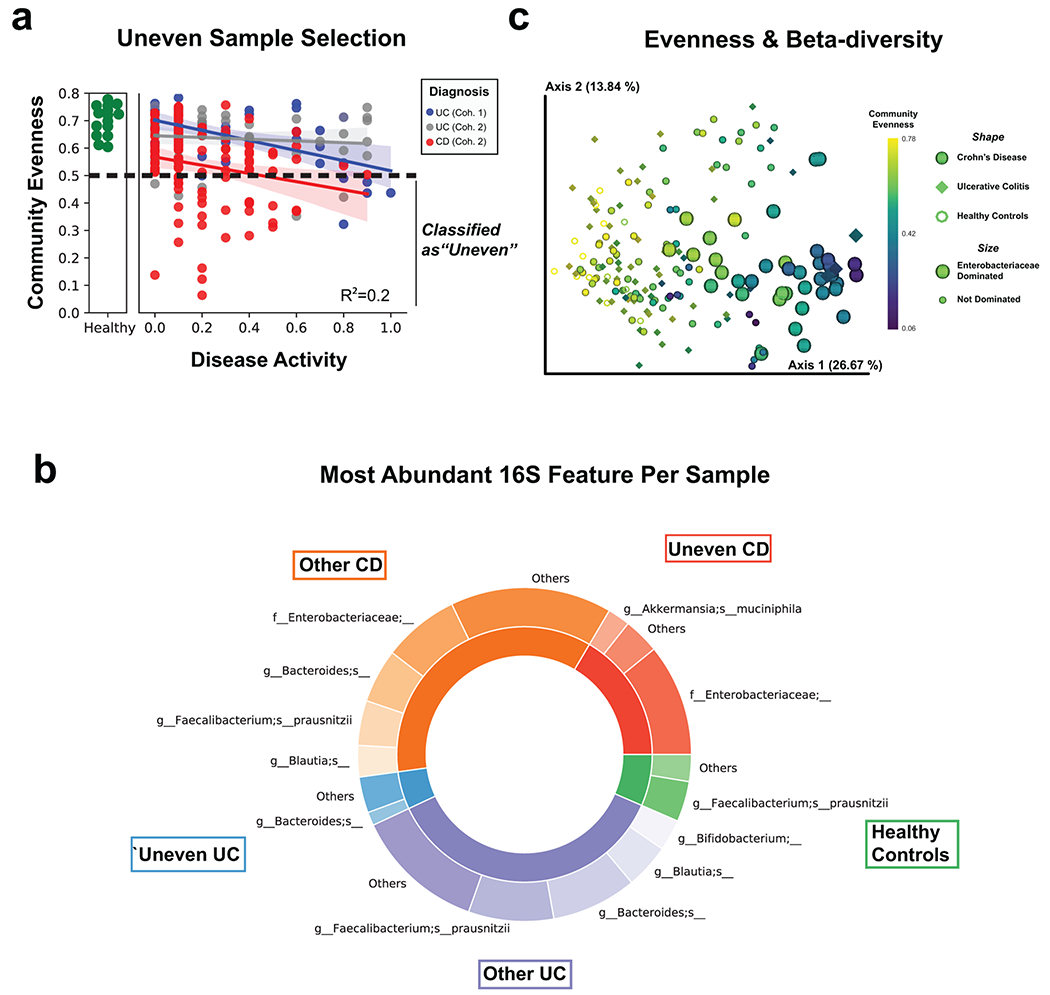
Extended Data Fig. 3. Characterizing uneven samples.

a, Alpha diversity (using Pielou’s evenness metric) by disease activity as shown in Figure 1b, but highlighting classification of samples as uneven when below Pielou Evenness of 0.5. Best-fit linear regression lines with 95% confidence intervals are shown and an R2 statistic is reported from an ordinary least-squares regression using the formula (Disease Activity + Diagnosis + Disease Activity:Diagnosis). b, 16S beta-diversity is strongly influenced by community evenness. The weighted UniFrac distance metric was used and each sample was classified by community evenness, diagnosis and whether the most abundant 16S feature was from the family Enterobacteriaceae. c, Characterizing the most abundant 16S features. Each sample was classified as either “Uneven” (Pielou Evenness < 0.5) or “Other” as shown in (a). Abundances of each amplicon sequence variant were summed by their highest resolution taxonomic annotation and the most abundant feature of samples are represented in a donut plot. The inside ring represents the fractional composition of each patient subgroup and the outside rings represents the number of patients within each subgroup whom share a similar most abundant feature. Less common features for each patient subgroup are counted as “Other”.
