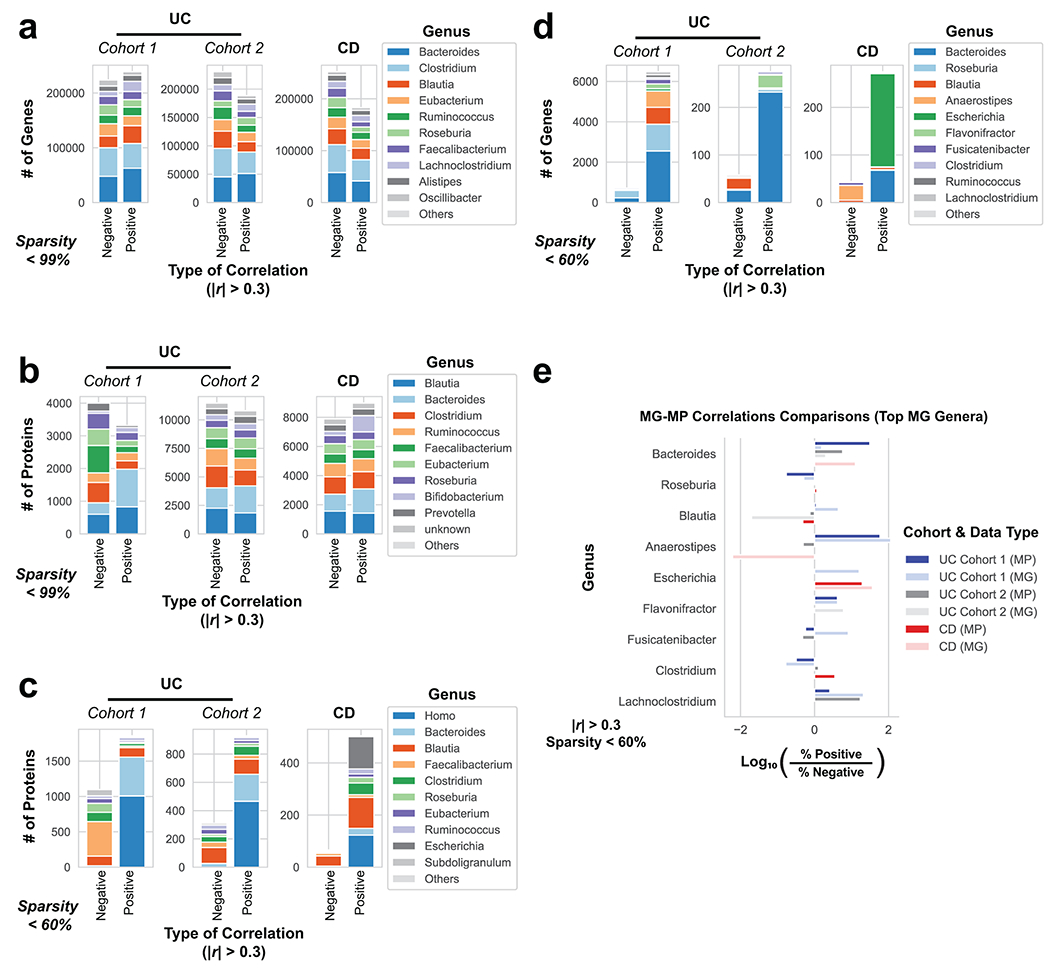
Extended Data Fig. 4. Comparison of genera annotations from genes and proteins correlated to disease severity.

The genus composition of genes and proteins correlated to disease activity were compared with different levels of sparsity as a requirement for being deemed “correlated”. Stacked bar charts summarize the number of genes or proteins from the 10 most common genus assignments when correlated to either partial Mayo severity in UC cohorts or CDAI in CD patients. Only genes or proteins with |r| > 0.3 from linear regression were included. a, Genus composition of significant positively and negatively correlated genes from the MG with no sparsity requirement. b, Genus composition of significantly positively and negatively correlated proteins from the MP with no sparsity requirement. c, Genus composition of associated proteins as in Fig. 3a, but without removing host proteins (genus Homo). d, Genes correlated to disease activity from the MG when filtering out genes appearing in less than 40% of patients within each category. e, Summary of comparing the portions of positively and negatively correlated genes and proteins from each patient cohort when examining the top 10 genera identified in the MG. This analysis is analogous to Fig. 3b, but displaying the top MG genera.
