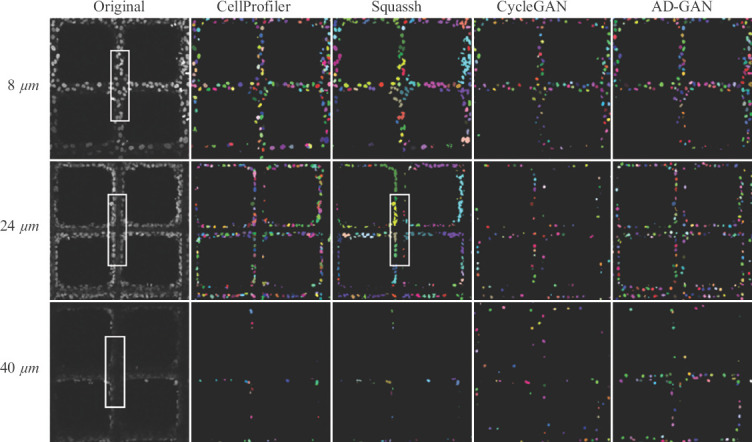
Figure 6.

Comparison of segmentation performance from Squassh, Cellprofiler, CycleGAN and AD-GAN under low cell density when culturing at day 1 using A549. Grayscale CLSM images with low cell density collected from different depths of the volume are shown in the first column. Segmentation results from the four methods are shown in column. Different colors are used to discriminate individual nuclei.
