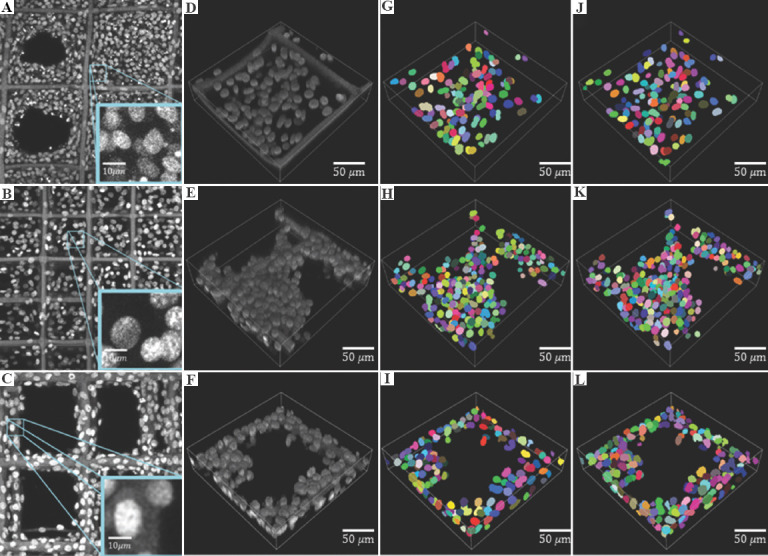
Figure 9.

Segmentation performance comparison cross cell lines. (A-C) Grayscale confocal laser scanning microscopy images of A549, NIH-3T3 and HeLa cells cultured on scaffolds, respectively. (D-F) 3D nuclei of A549, NIH-3T3 and HeLa. (G-I) Segmentation results of (D), (E) and (F) using the Aligned Disentangled Generative Adversarial Network (AD-GAN) model trained with A549 cell lines. (J-L): Segmentation results of (D), (E) and (F) using the AD-GAN model trained with NIH-3T3.
