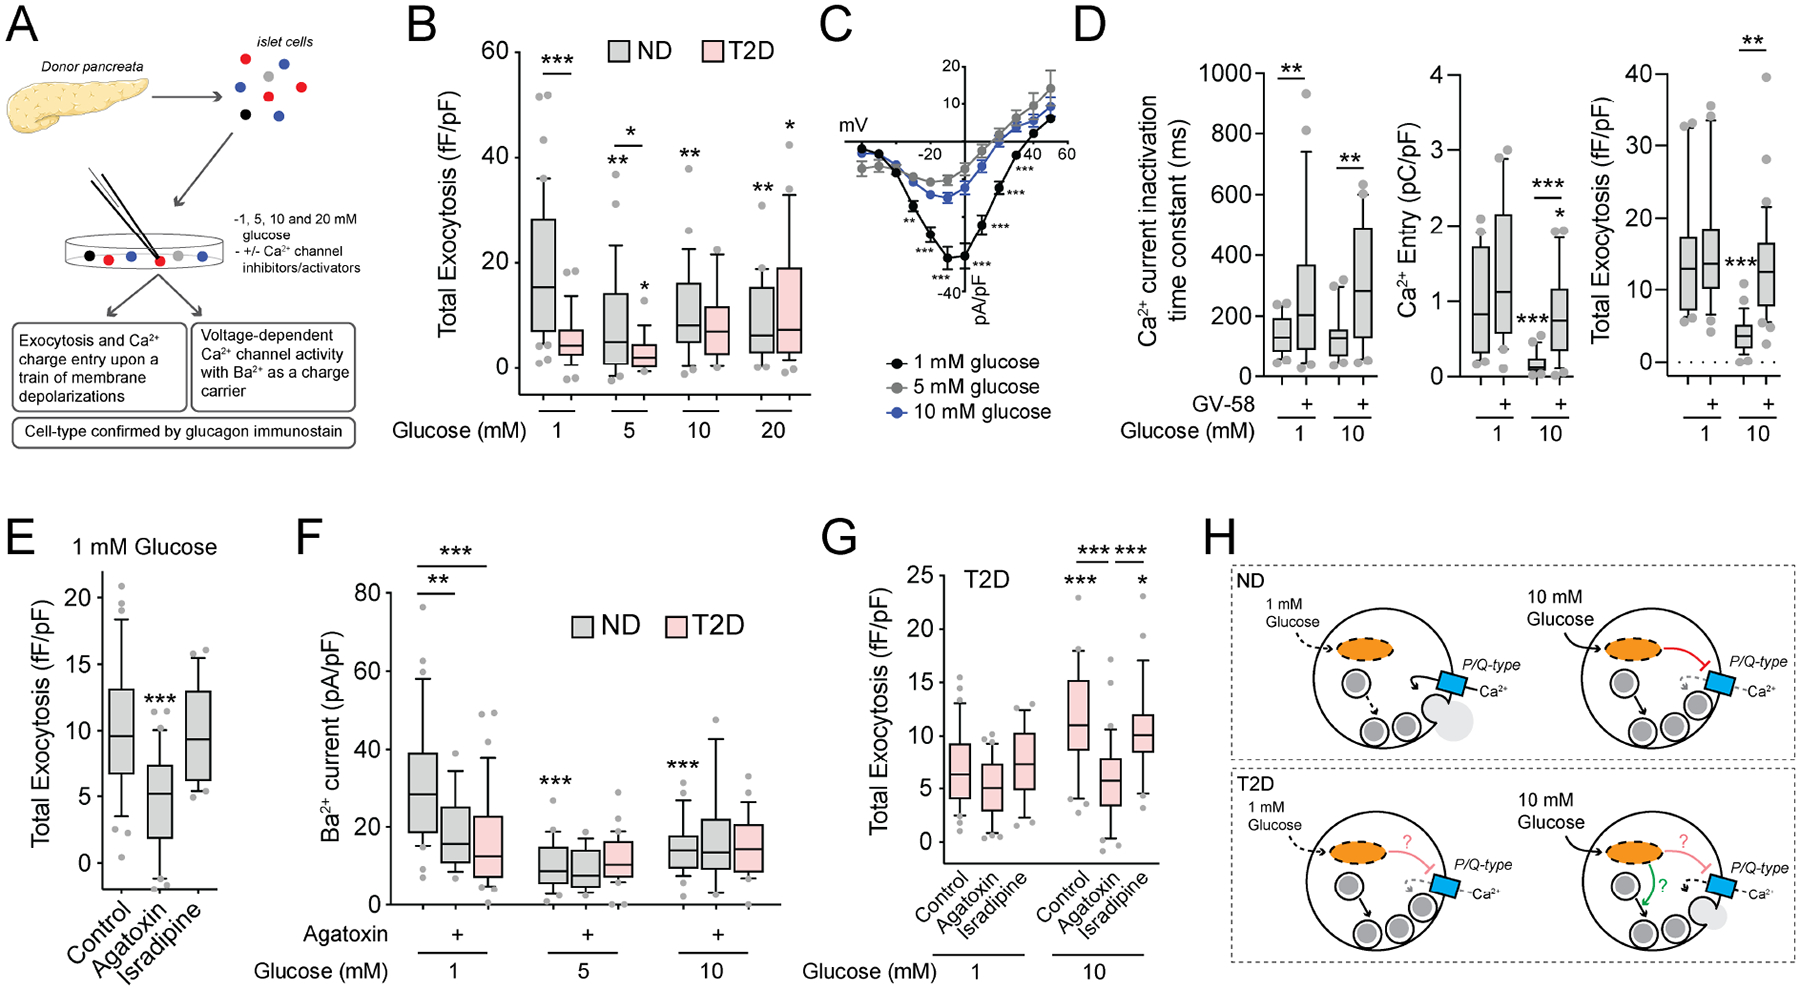
Figure 1. Glucose suppresses human α-cell exocytosis in concert with P/Q-channel activity.

A) Schematic diagram illustrating that human islets were isolated, dispersed and cultured for 1–2 days prior to whole-cell patch-clamp and subsequent α-cell identification by glucagon immunostaining.
B) Total exocytosis upon a series of ten membrane depolarizations with increasing glucose in ND α-cells (grey; n = 42, 28, 24, 20 cells from 9 donors) and T2D α-cells (pink; n = 29, 16, 12, 27 cells from 6 donors).
C) Voltage-dependent Ca2+ channel activity, with Ba2+ as a charge carrier, in ND α-cells with increasing glucose (n = 31, 24, 27 cells from 7 donors).
D) Effect of the P/Q-type Ca2+ channel activator GV-58 (10 μM) on Ca2+ current inactivation (left; n = 24, 28, 22, 21 cells) and charge entry (middle; n = 22, 20, 20, 23 cells) during a 500 ms depolarization from 70 to 0 mV, and total exocytosis (right; n = 23, 22, 28, 34 cells) at 1 and 10 mM glucose (3 donors).
E) Effect of the P/Q-type Ca2+ channel blocker agatoxin (100 nM) and the L-type Ca2+ channel blocker isradipine (10 μM) on ND α-cells exocytosis at 1 mM glucose (n = 34, 30, 21 cells from 5 donors).
F) Voltage-dependent Ca2+ channel activity at 0 mV (Ba2+ as a charge carrier) with increasing glucose in ND α-cells, with agatoxin (100 nM), and in T2D α-cells (n = 31, 16, 24, 15, 27, 18 cells from 7 ND donors, and 34, 31, 27 cells from 5 T2D donors).
G) Effect of agatoxin (100 nM) and the L-type Ca2+ channel blocker isradipine (10 μM) on total exocytosis in T2D α-cells at 1 and 10 mM glucose (n = 30, 31, 29, 32, 31, 29 cells from 5 T2D donors).
H) Putative scheme for glucose-regulation of depolarization-induced exocytosis in α-cells, and the dysfunction seen in T2D.
*P < 0.05; **P < 0.01; and ***P < 0.001 by one-way ANOVA (D,E,G) or two-way ANOVA (B,C,F) and Tukey post test compared with 1 mM glucose control, versus the ND control (C) or as indicated.
