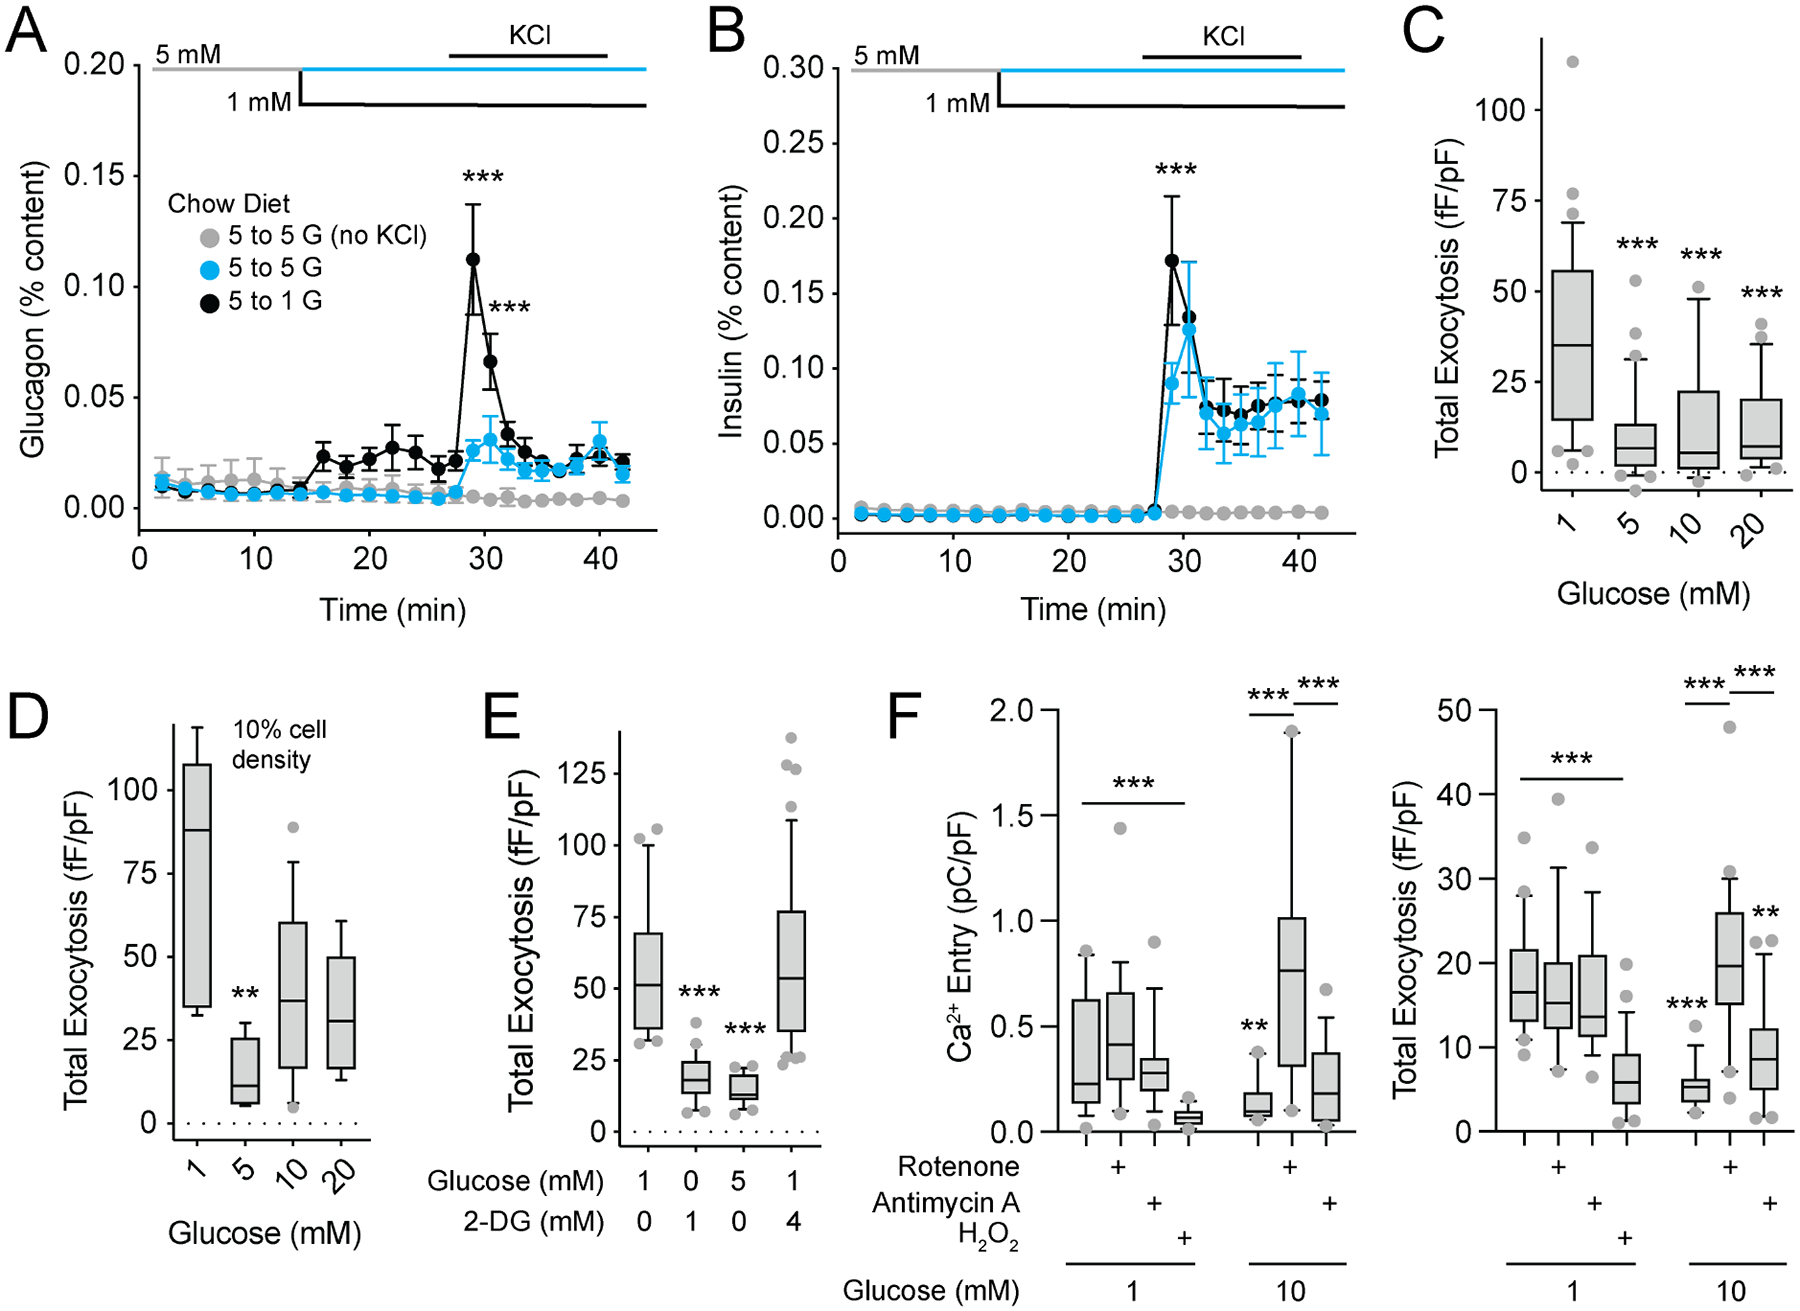
Figure 3. Glucose-suppression of mouse α-cell exocytosis requires glucose metabolism and the mitochondrial respiratory chain.

A-B) Glucagon (A) and insulin (B) secretion from islets of 10–12 week old male C57bl6 mice as glucose remains at 5 mM (blue) or drops from 5 to 1 mM (black), and upon subsequent stimulation with 20 mM KCl. A control (grey) was maintained at 5 mM glucose (n = 3, 3, 3 mice).
C-D) Mouse α-cell exocytosis with increasing glucose (n = 32, 30, 14, 27 cells from 4 mice), and at very low (10% of normal) density (D; n = 6, 6, 13, 9 cells from 2 mice).
E) Effect of 2-Deoxy-D-glucose (2-DG) on glucose-regulation of α-cell exocytosis (n = 20, 20, 21, 46 cells from 4 mice).
F) Effect of the complex I inhibitor rotenone (0.5 μM) and the complex III inhibitor antimycin A (0.5 μM) on α-cell Ca2+ charge entry during a 500 ms depolarization from −70 to 0 mV, and exocytosis, at 1 and 10 mM glucose. Also the effect of direct intracellular dialysis of H2O2 (10 μM) via the patch pipette at 1 mM glucose (left n = 19, 15, 18, 17, 11, 19, 16 cells; and right n = 20, 19, 16, 26, 16, 26, 22 cells from 3 mice).
**- P < 0.01; and ***- P < 0.001 by one-way ANOVA (C,D,E) or two-way ANOVA (A,B,F), followed by Tukey post-test to compare points or groups with the 5 mM glucose points (A, B) or with the 1 mM glucose control group.
