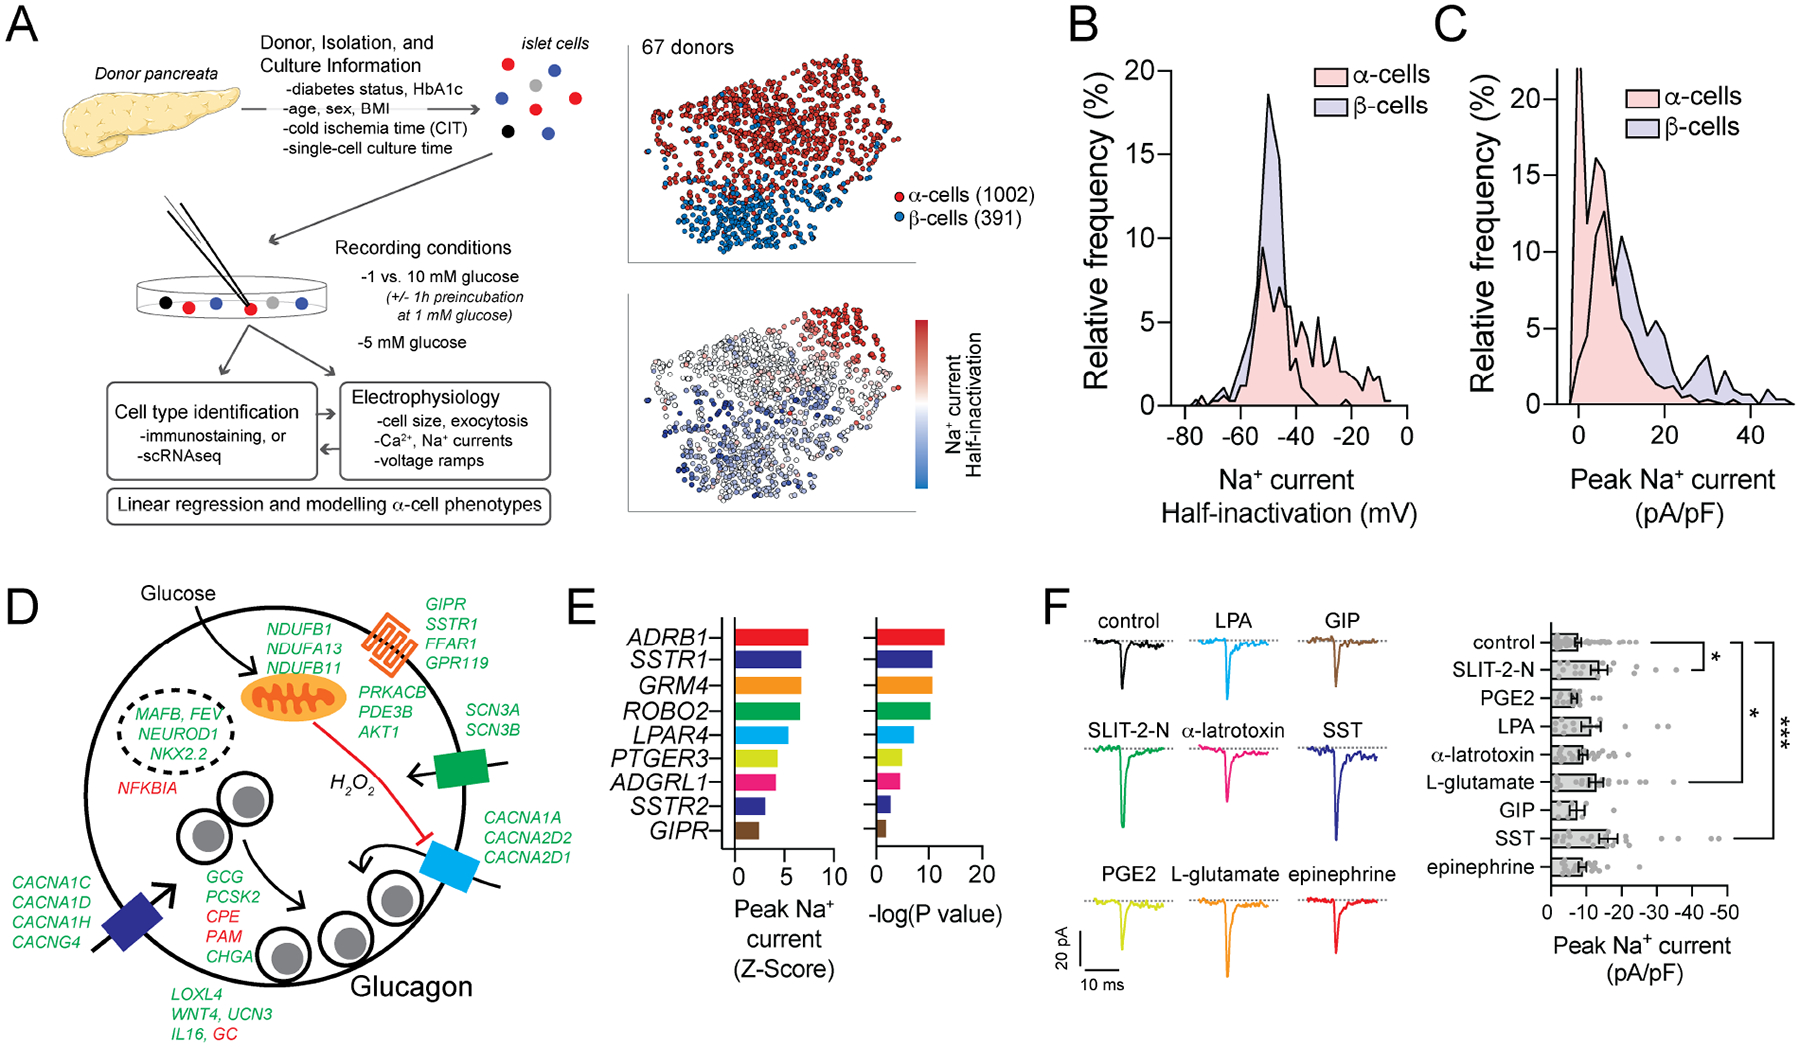
Figure 5. Na+ current properties correlate with transcriptomic markers of α-cell function.

A) Schematic diagram illustrating an expanded dataset of electrically profiled human islet cells, and tSNE representations of α- and β-cells identified by immunostaining or sequencing along with the relative distribution of Na+ current half-inactivation values.
B-C) The distribution of Na+ current amplitudes (B) and voltage-dependence of half-inactivation values (C) of β-cells (light blue) and α-cells (pink) (see also Suppl Fig 4C).
D) Selected significant positive (green) and negative (red) transcript correlates of peak Na+ current from α-cells of ND donors mapped to a proposed scheme of glucose-regulation of glucagon exocytosis (see also Suppl Table 6).
E) Correlation of α-cell peak Na+ current and selected transmembrane signaling receptor transcripts (see also Suppl Fig 5).
F) In α-cells of 6 donors with no diabetes (ND), Na+ currents measured with receptor agonists (colors matching receptors shown in panel E) upon depolarization from −70 to −10 mV. Peak current is shown at right: control (n = 53 cells); 0.5 μg/ml SLIT-2-N (n = 17 cells); 10 μM prostaglandin E2 (PGE2, n = 17 cells); 0.5 μM lysophosphatidic acid (LPA, n = 14 cells); 0.2 μg/ml α-latratoxin (n = 24 cells); 10 mM L-glutamic acid (n = 21 cells); 100 nM glucose-dependent insulinotropic polypeptide (GIP, n = 7 cells); 200 nM somatostatin (SST, n = 24 cells); 5 μM epinephrine (n = 22 cells).
*- P < 0.05 and ***- P < 0.001 by one-way ANOVA, followed by the Benjamini and Hochburg post-test to method to compare groups controlling for false discovery rate.
