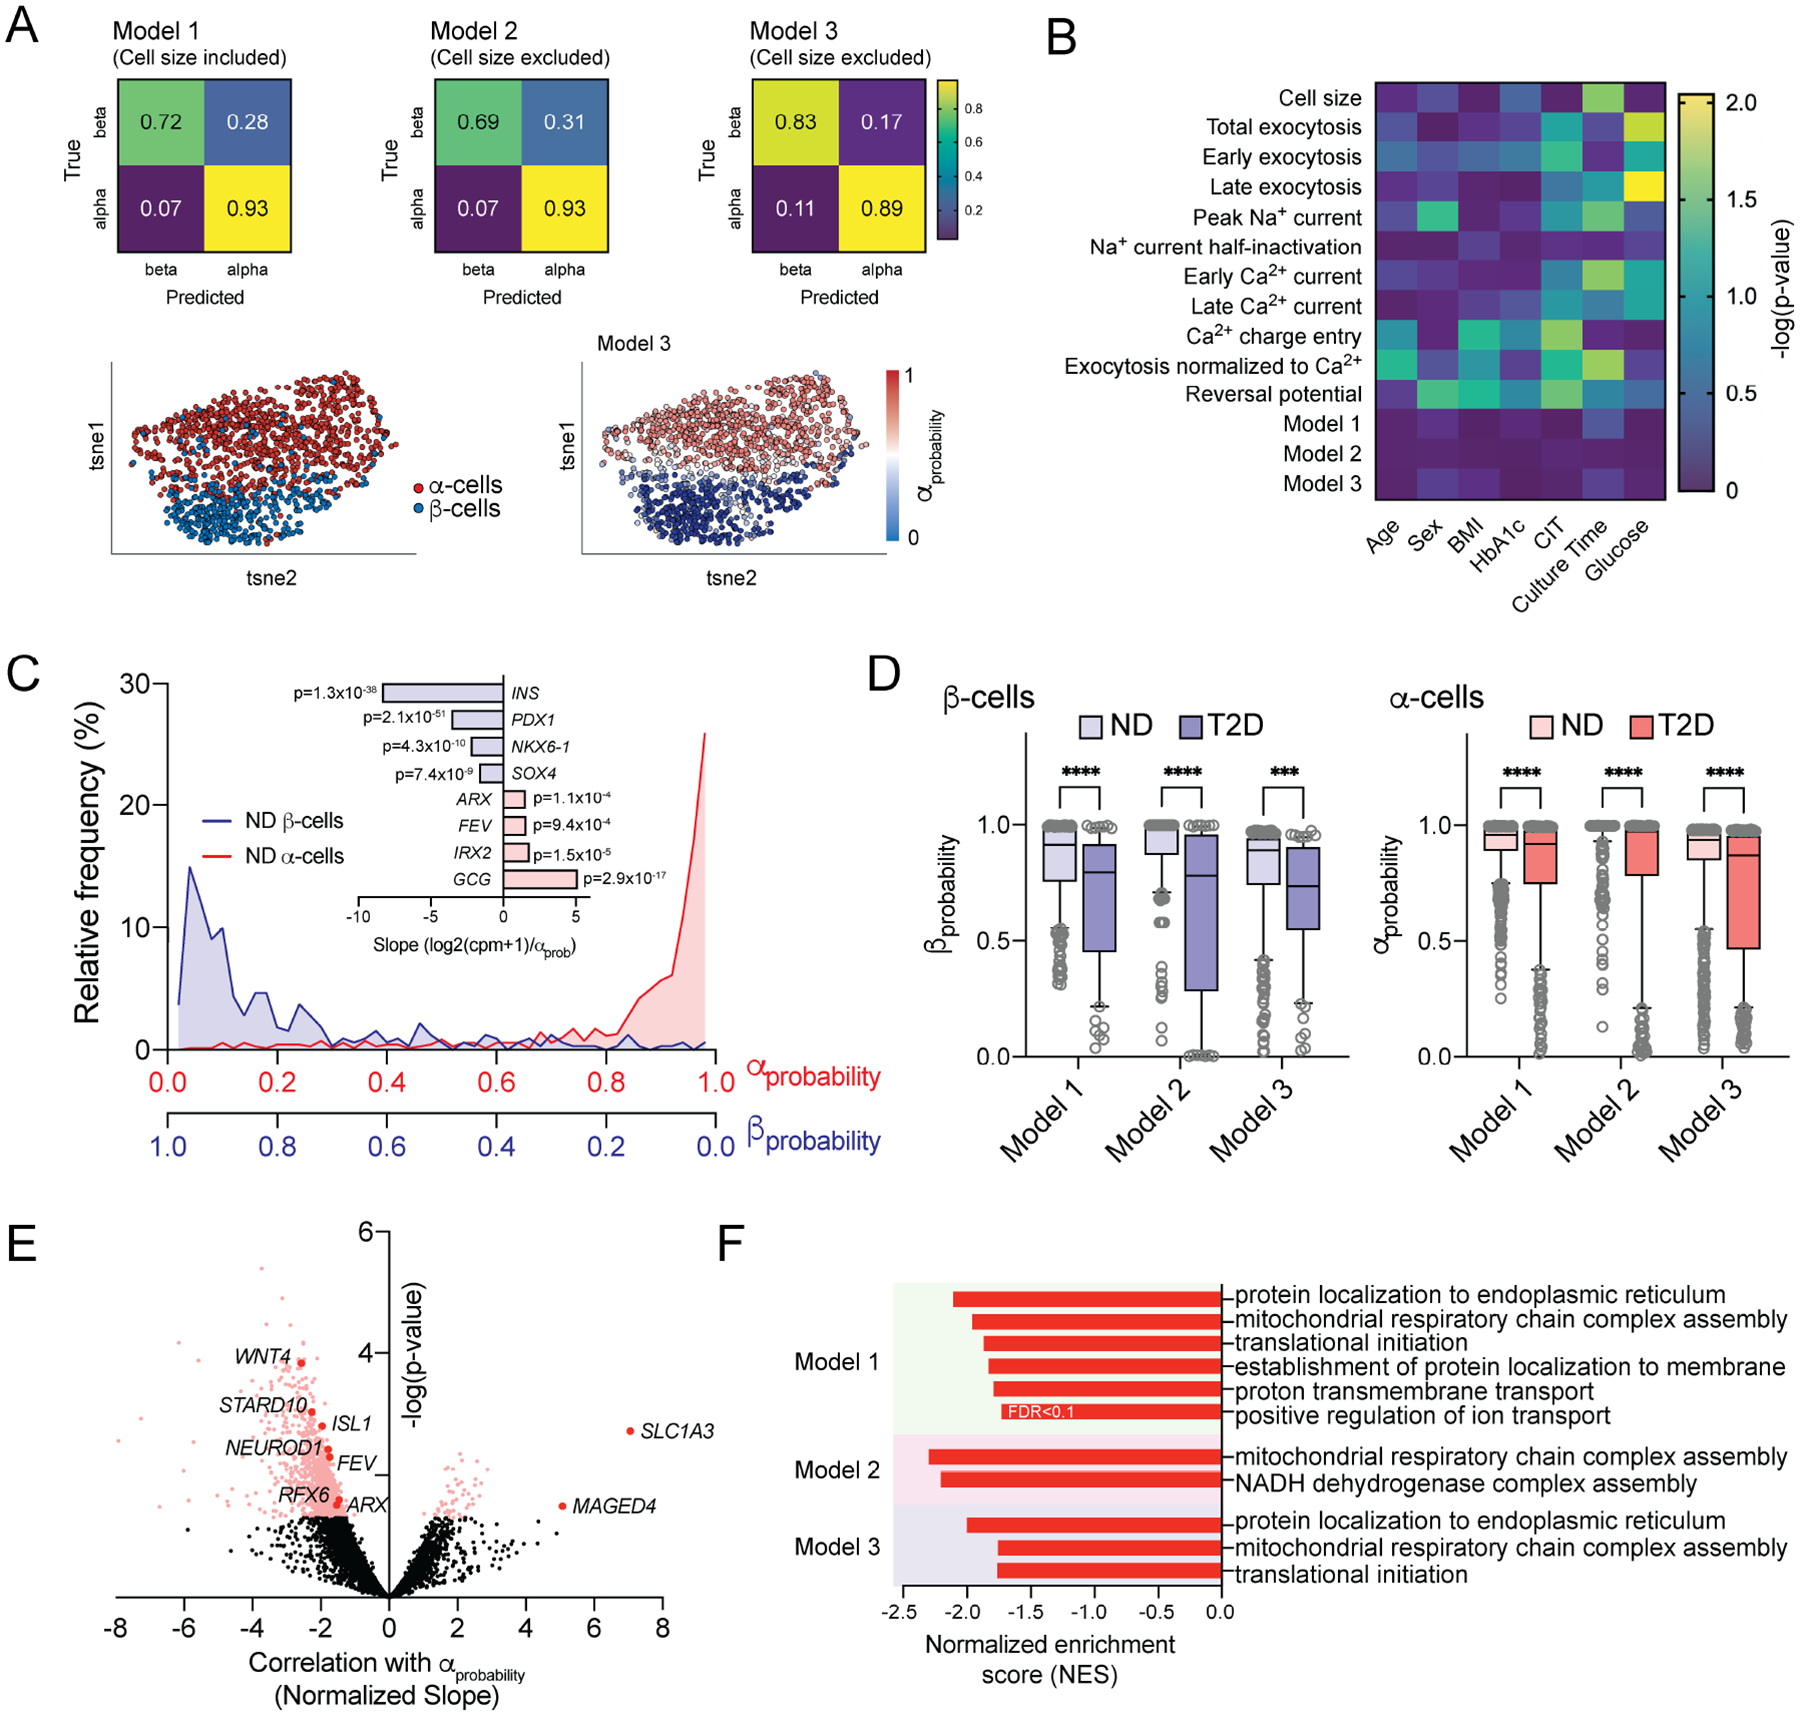
Figure 6. Electrophysiological fingerprints define a loss of ‘functional identity’ in T2D α-cells.

A) Classifier models trained on islet cell electrical properties of α- and β-cells from donors with no diabetes (ND) using Optimizable Ensemble or Extreme Gradient Boosting (XGBoost) approaches, identify cell types with high accuracy regardless of the inclusion or exclusion of cell size from training data. 80% of data was used for training. 20% of data was reserved for validation and generation of confusion matrices. tSNE plots show cell types determined by immunostaining or sequencing (left) and assigned αprobability scores (right).
B) Ordinary least squares multiple regression of electrophysiological properties of α-cells from ND donors, Model scoring, and donor/isolation variables.
C) Calculated αprobability (and βprobability) values from Model 3 applied to cells collected for patch-seq, without a priori knowledge of cell type and correlation with canonical β-cell (light blue) and α-cell (pink) markers.
D) βprobability and αprobability values derived from all three models, of all β- and α-cells from ND or T2D donors.
E) Volcano plot of transcript correlations with Model 3 αprobability values (slope/standard deviation) in α-cells from donors with T2D. A negative correlation indicates transcripts associated with reduced αprobability.
F) Significantly enriched GO: Biological Pathways from Gene Set Enrichment Analysis (GSEA) performed using αprobability - transcript correlation slopes of α-cells from donors with T2D in all three Models as weighting.
***- P < 0.001 and **** P < 0.0001 as indicated within models using non-parametric Kruskal-Wallis test (D) followed by Dunn’s post-test to correct for multiple comparisons. Pink/red points in E indicate significance at P < 0.05. False discovery rate (FDR) for pathways identified by GSEA in F were <0.05 unless indicated otherwise.
