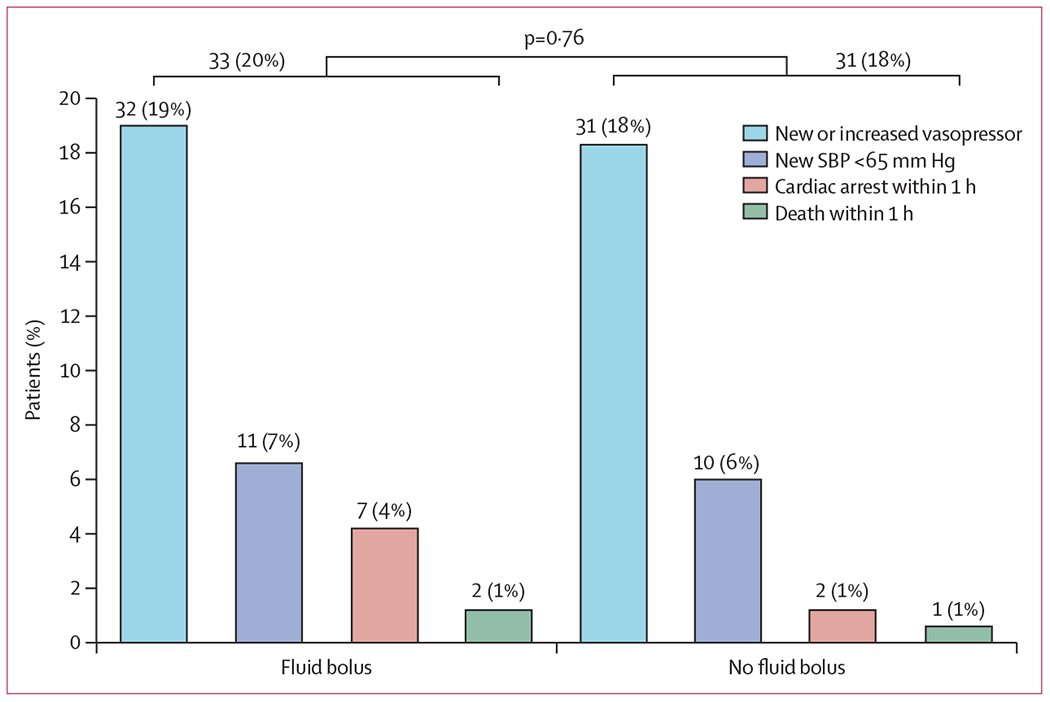
Figure 2: Cardiovascular collapse in the fluid bolus vs no fluid bolus groups.

Horizontal bars represent the overall incidence of the primary outcome in each group. The p value represents the test for a difference between groups in the overall incidence of the primary outcome. Number (%) of patients is given above each bar. SBP=systolic blood pressure.
