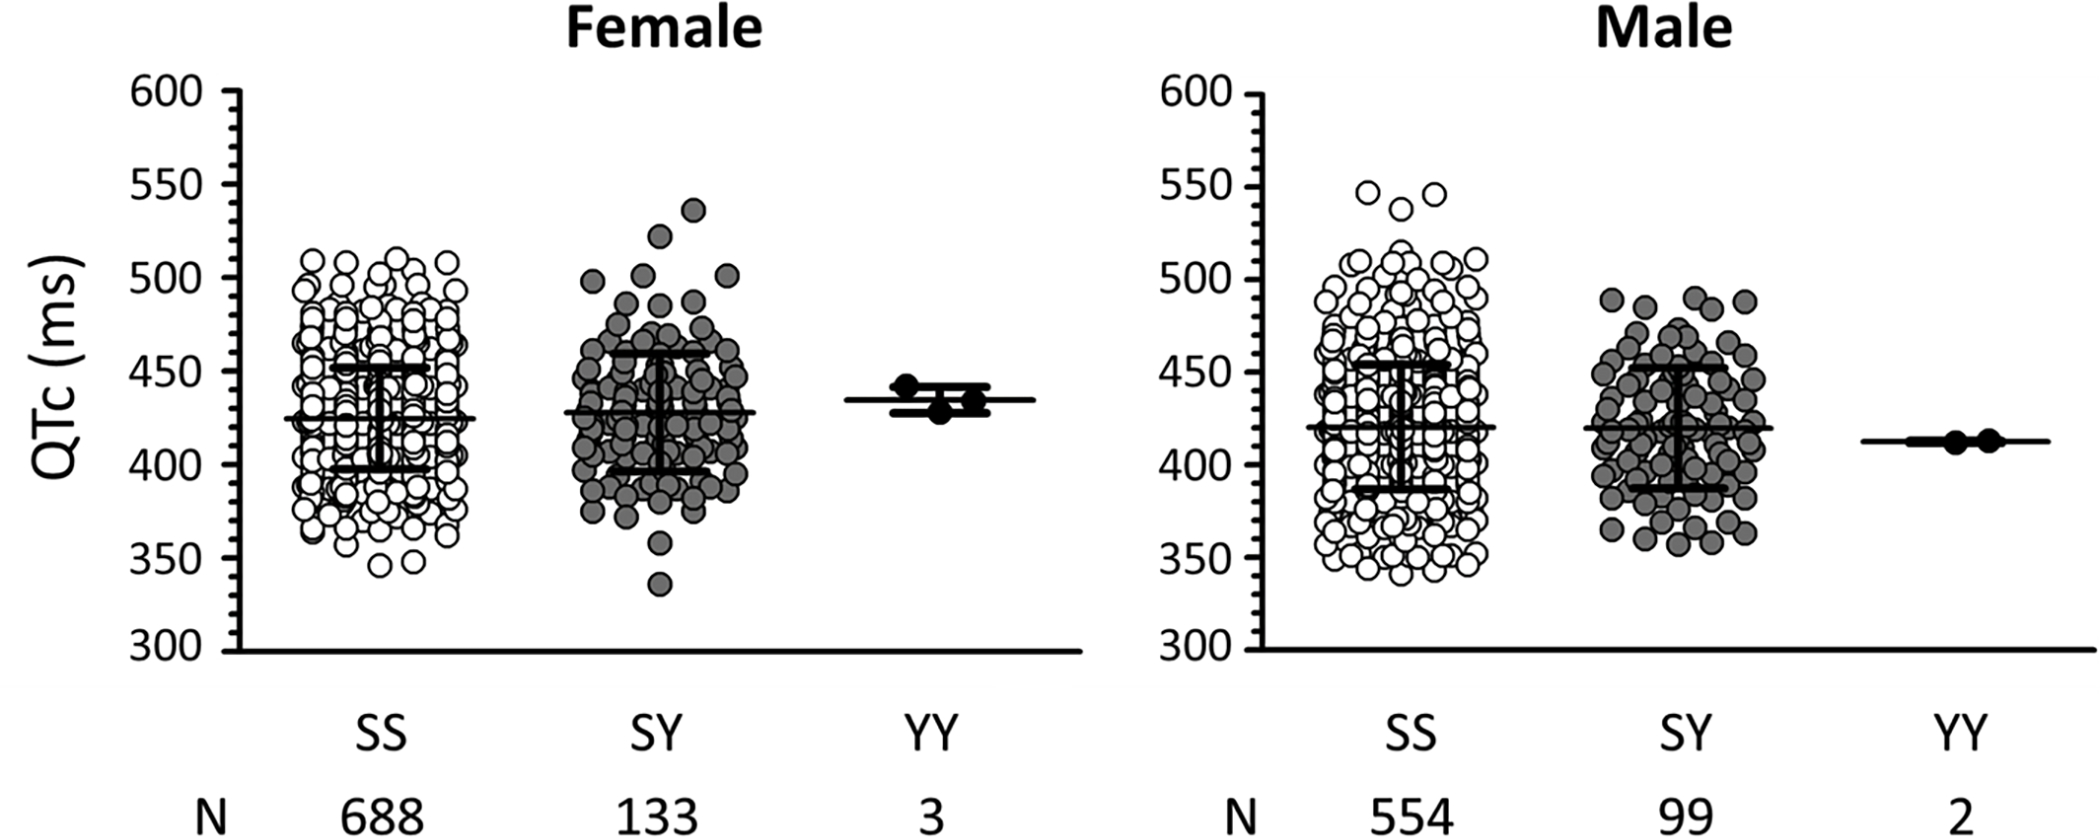
Figure 1. QTc intervals in African American subjects.

QTc intervals are plotted separately for females (left) and males (right). Open symbols denote intervals with the SS genotype, grey symbols with the SY genotype, and black symbols the YY genotype. N indicates the number of subjects included in the study. QTc intervals are presented in Supplemental Table S2.
