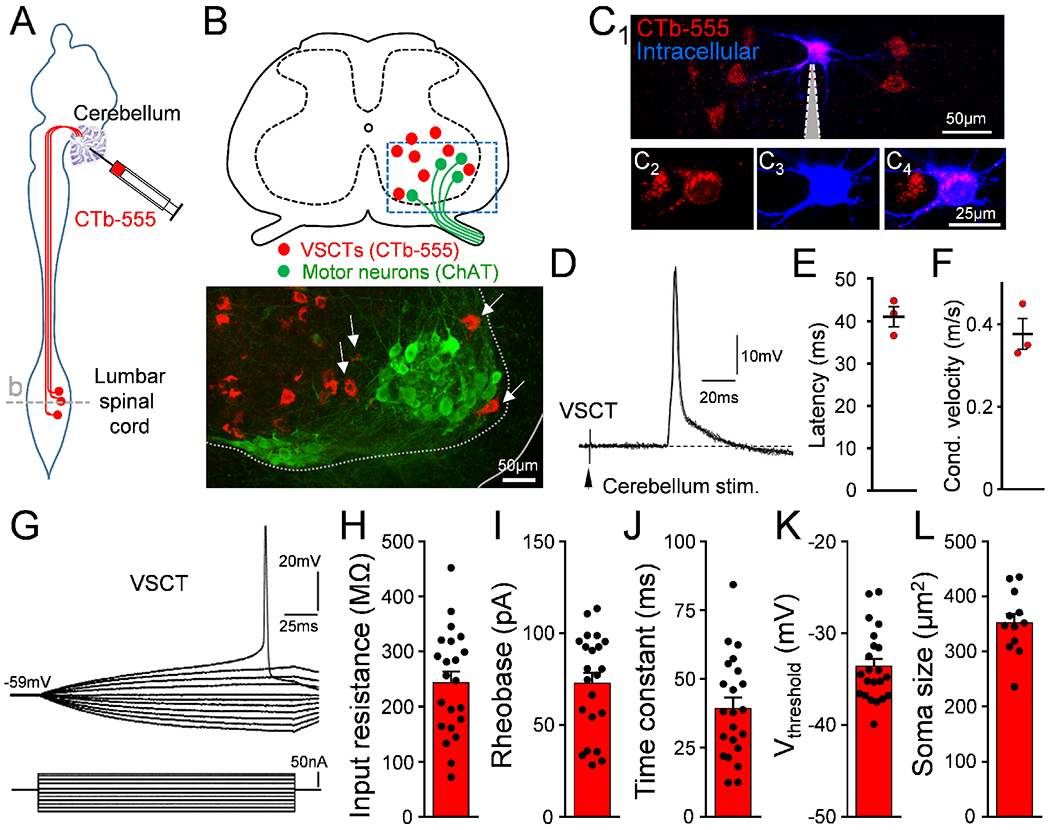
Figure 1. VSCTs located near or within the motor neuron nucleus are hyperexcitable.

(A) CTb-555 injected in cerebellum at P0 to label VSCTs in the L1/L2 lumbar spinal cord. (B) Drawing of the L2 spinal cord [dashed line in (A)] and confocal image from the ventral horn (box in drawing) showing VSCTs (red) near or within (arrows) MNs at P4 (ChAT; green) (N=12). (C1-4) Individual VSCTs (CTb-555; red) were visually targeted for intracellular recording (n=22; N=22 mice) using 2P-laser microscopy in the intact ex vivo spinal cord (intracellular dye: Cascade Blue dextran). Grey: patch electrode. (D) Five superimposed antidromic action potentials (APs) in a P3 L1 VSCT after cerebellum electrical stimulation at 1 Hz. (E) Latency of antidromic APs for 3 VSCTs (N=3). (F) Conduction velocity. (G) Superimposed traces from a current/voltage plot in a P4 L2 VSCT. VSCTs’ input resistance (H) (n=22), rheobase (I), time constant (J), threshold for induction of AP (K), and soma size (L) (n=12). Data are represented as mean ± SEM. See also Fig. S1.
