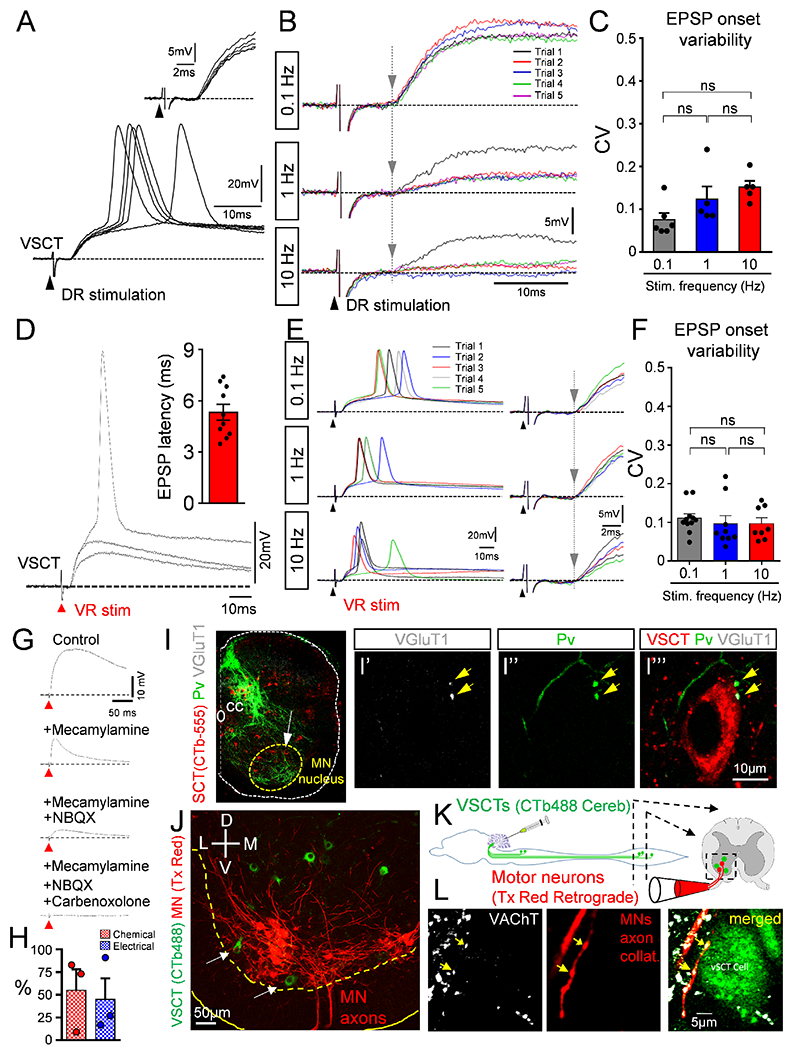
Figure 2. VSCTs receive synapses from proprioceptors and motor neuron axon collaterals.

(A) Superimposed responses from a P5 L1 VSCT after ipsilateral L1 dorsal root (DR) stimulation. Inset shows constant short latency responses. (B) As in (A) from a P3 L2 VSCT after ipsilateral DR-L2 stimulation at 0.1, 1 and 10Hz. Consecutive responses are color coded. Grey vertical line indicates constant latency of the response onset. (C) Coefficient of variation (CV) of latency in the onset of EPSP in VSCTs after DR stimulation (ns: no significance; One Way ANOVA, Brown-Forsythe test). (D) Superimposed graded EPSPs from a P4 L2 VSCT after ipsilateral homosegmental ventral root (VR) stimulation. Inset: latency of EPSPs in 10 VSCTs. (E) As in (D) from a P4 L2 VSCT after ipsilateral VR-L2 stimulation at 0.1, 1 and 10Hz. Traces on the right are expanded in time. Grey vertical line indicates constant latency. (F) CV of the onset of EPSPs in VSCTs evoked by VR stimulation (One Way ANOVA). (G) EPSP in a P4 L2 VSCT after ipsilateral VR stimulation in control solution, and sequential addition of mecamylamine (50μM), NBQX (20μM) and carbenoxolone (100μM). (H) Percentage of response in VSCTs due to chemical (red) and electrical (blue) transmission (n=3 VSCTs, N=3 mice). (I) SCTs (CTb-555; red), parvalbumin (green) and VGlu1 (white) immunoreactivity in L1 at P4 (n=7). (I’-I’”) L1 proprioceptive fibers (parvalbumin; green) and VGluT1+ synapses (white; yellow arrows) onto a VSCT (red) shown by white arrow in (I). (J) Ventral horn confocal image showing VSCTs (green) located close or within (arrows) the MN (red) nucleus. (K) Protocol in which CTb-488 injected in cerebellum at P0 to label VSCTs (green). At P4, MNs were backfilled with Texas Red dextran (red) from the VR using ex vivo spinal cord. (L) Single plane confocal images showing VAChT immunoreactivity (white), MN axon collaterals (red) and a VSCT (green), revealing two synapses (yellow arrows) (n=7 VSCTs, N=3 mice). Data are represented as mean ± SEM. See also Figs. S1 and S2.
