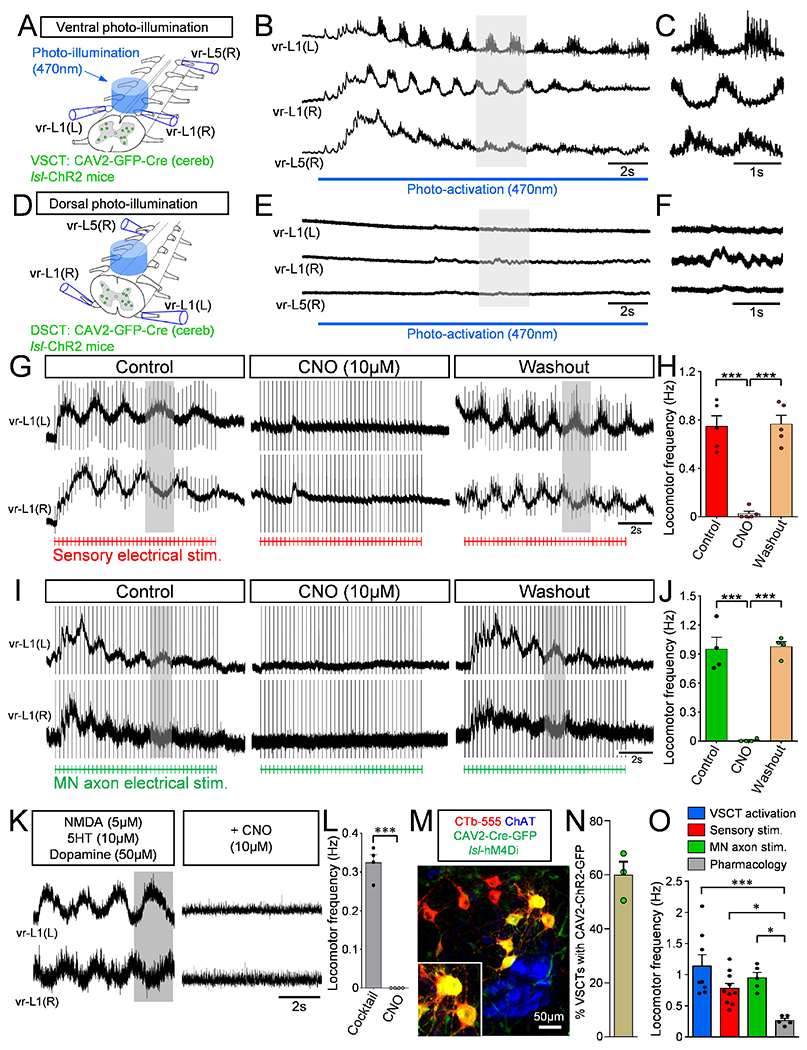
Figure 4. VSCTs are necessary and sufficient for locomotor-like behavior.

(A) Bilateral illumination with a 470nm LED from the ventral aspect of L1 and L2 segments resulting in locomotor behavior recorded from L1 and L5 VRs (B) in ex vivo spinal cord at P4. (C) Expanded traces (grey box in B) showing alternating activity between VRs (N=8). (D) Bilateral photoactivation of the dorsal aspect of the L1/L2 spinal cord. (E) Extracellular VR responses following dorsal photo-activation (same spinal cord as in B but flipped over 180°). (F) Time-expanded traces (grey box in E). (G) Locomotor behavior evoked by sensory stimulation before, during and after CNO washout in a spinal cord expressing hM4Di in VSCTs (duration of stimulation: red drawing at the bottom, 4Hz for 10s). (H) Locomotor frequency after sensory stimulation before, during CNO and after washout (N=5). (Control vs. CNO: *** p<0.001; CNO vs. Washout: *** p<0.001, One Way ANOVA, Tukey’s post hoc test). (I) As in (G), locomotor behavior induced following VR stimulation (bottom in green, 5Hz for 10s) before, during and after CNO application. (J) Locomotor frequency following MN axon stimulation before, during and after CNO (N=4). (Control vs. CNO: *** p<0.001; CNO vs. Washout: *** p<0.001, One Way ANOVA, Tukey’s post hoc test). (K) Similar to (G) and (I), VR responses in which locomotor activity was induced by application of NMDA (5μM), 5HT (10μM) and dopamine (50μM). Exposure to CNO abolished locomotor activity. (L) Locomotor frequency evoked by pharmacological activation, before and after CNO application (N=4). *** p<0.001, Two-tailed student’s t-test. (M) Confocal image showing MNs (ChAT, blue), VSCTs (CTb-555, red) and CAV2-Cre-GFP (green) in a/s/-hM4Di mouse. (N) Percentage of VSCTs transduced with CAV2-GFP at P5 (N=3). (O) Locomotor frequency under photoactivation of VSCTs (blue), sensory (red) and MN stimulation (green), and cocktail of drugs (grey). (VSCT v Pharmacology: *** p<0.001; Sensory v Pharmacology, * p<0.05; MN axon v Pharmacology, * p<0.05, One Way ANOVA, Tukey’s post hoc test). Data are represented as mean ± SEM. See also Figs. S4 and S5.
