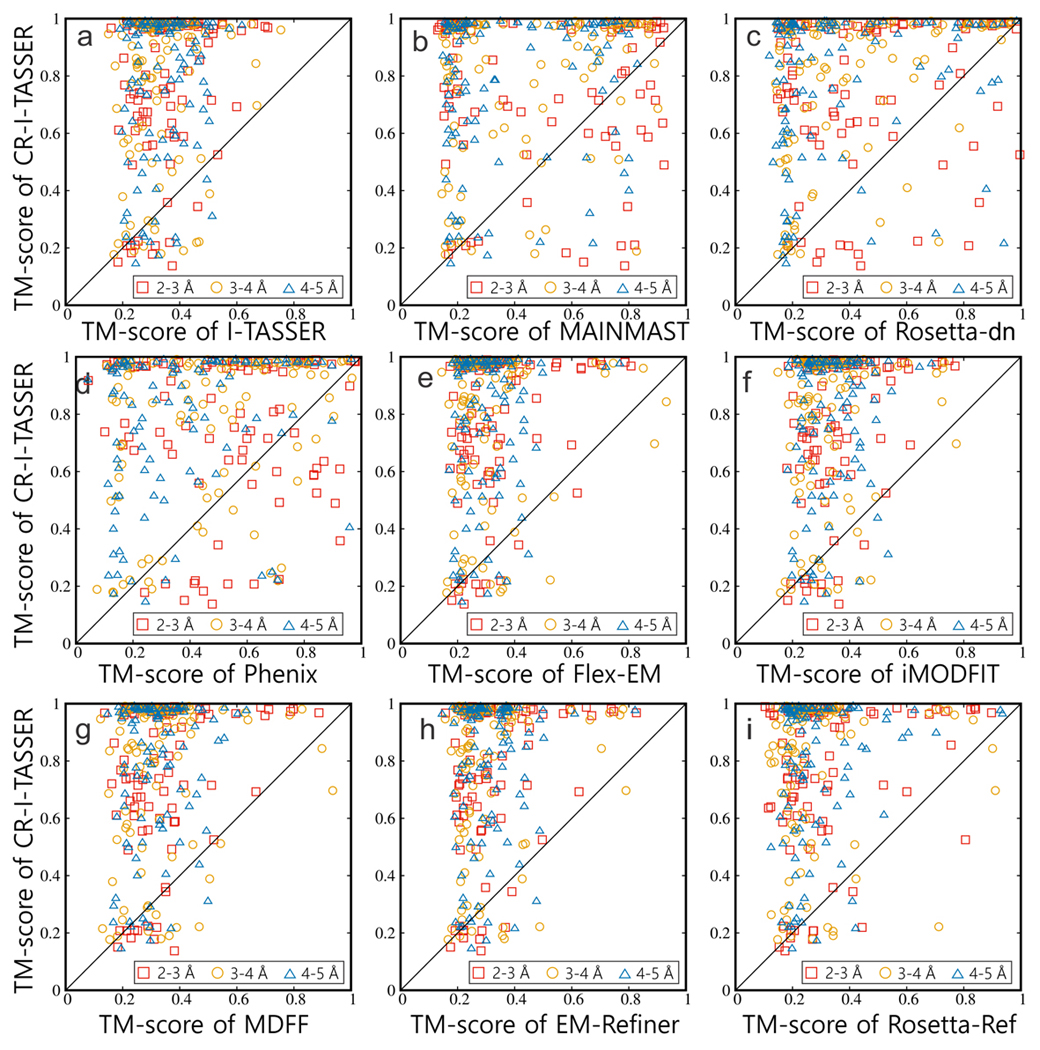
Figure 2.
TM-score comparisons of CR-I-TASSER with I-TASSER and eight other control methods on 301 Hard targets with 2–5 Å resolution simulated density maps. CR-I-TASSER versus (a) I-TASSER; (b) MAINMAST; (c) Rosetta-dn; (d) Phenix; (e) Flex-EM; (f) iMODFIT; (g) MDFF; (h) EM-Refiner; (i) Rosetta-Ref. The symbols with different colors and shapes denote different ranges of resolution: red square: 2–3 Å; yellow circle: 3–4 Å; blue triangle: 4–5 Å.

