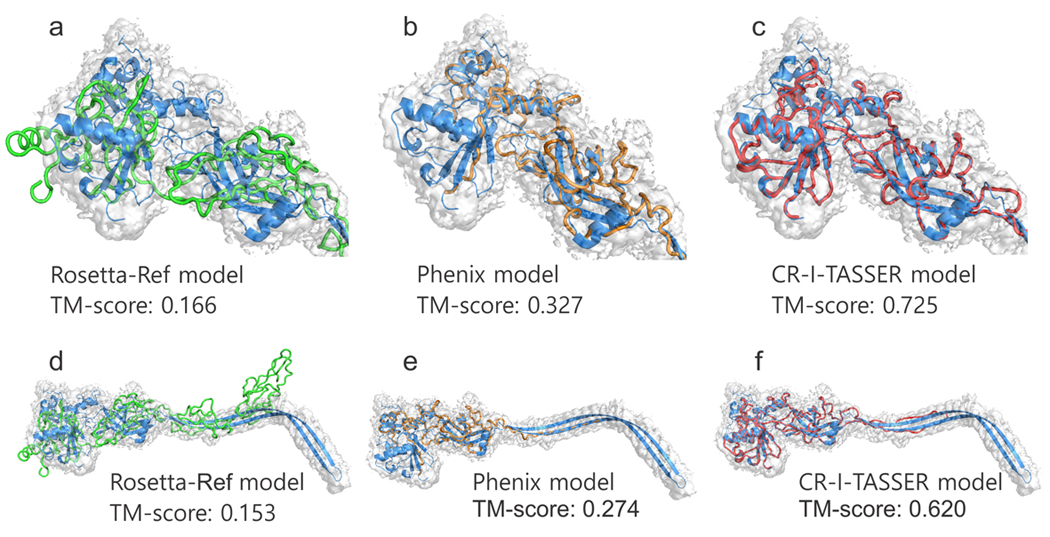
Figure 4.
Structure modeling results on a protective antigen pore protein (PDB ID: 3j9c-A) with high-resolution (2.9 Å) density map. (a-c) Predicted models by Rosetta-Ref (green), Phenix (orange) and CR-I-TASSER (red) are shown along with the native structure on the head globular domain (Residues 1–98; 185–423, blue). (d-f) The corresponding full-length models including the stem region. The predicted conformations and connection pattern can be found in Supplementary Fig. 6.

