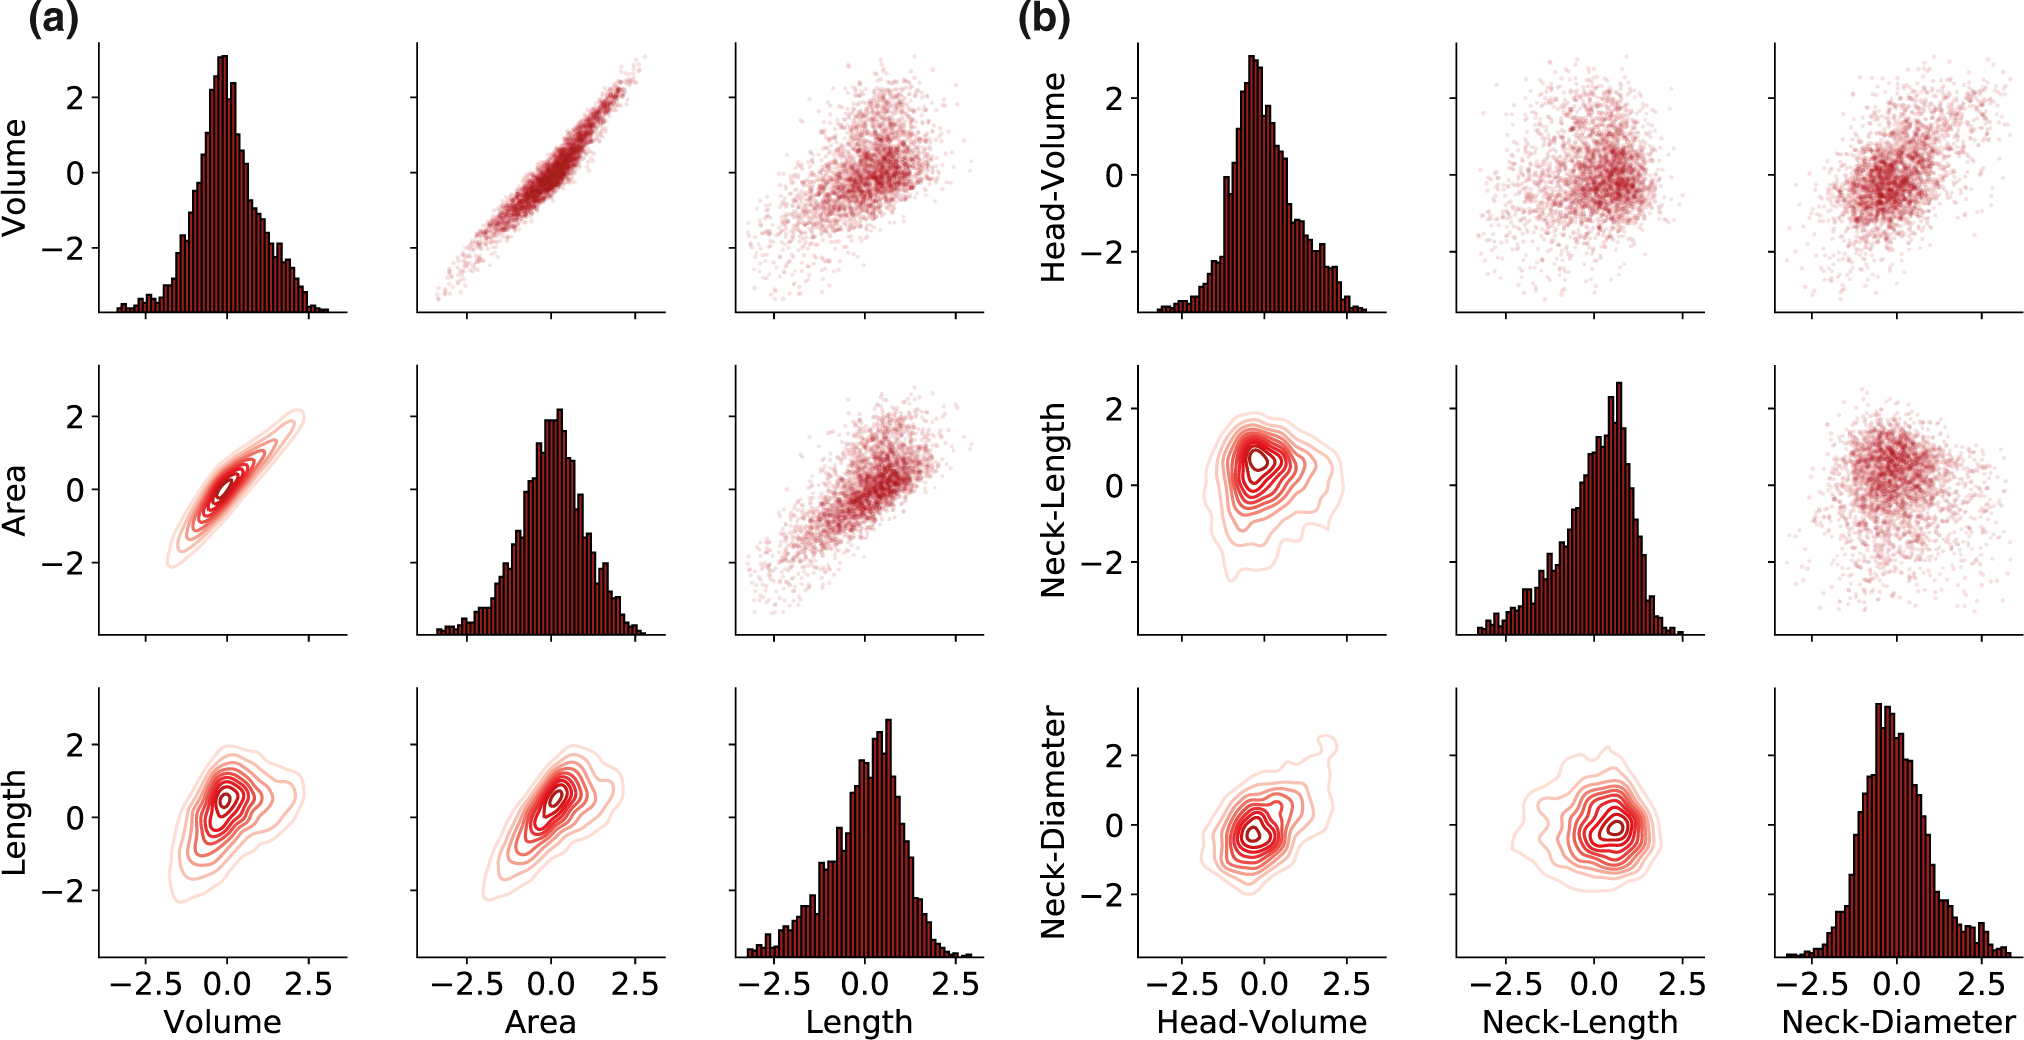
FIGURE 4.

Continuous distribution of spine morphological parameters. The pair-plot presents in the upper and lower triangles the pairwise relationships of the morphological parameters of all the spines. The marginal distribution of each parameter can be shown on the diagonal. (a) For the three basic parameters of the entire spine. (b) For neck and head parameters after segmentation. The data were logarithmic z-scored and the outliers (above 3 STD) were removed
