
FIGURE 5.
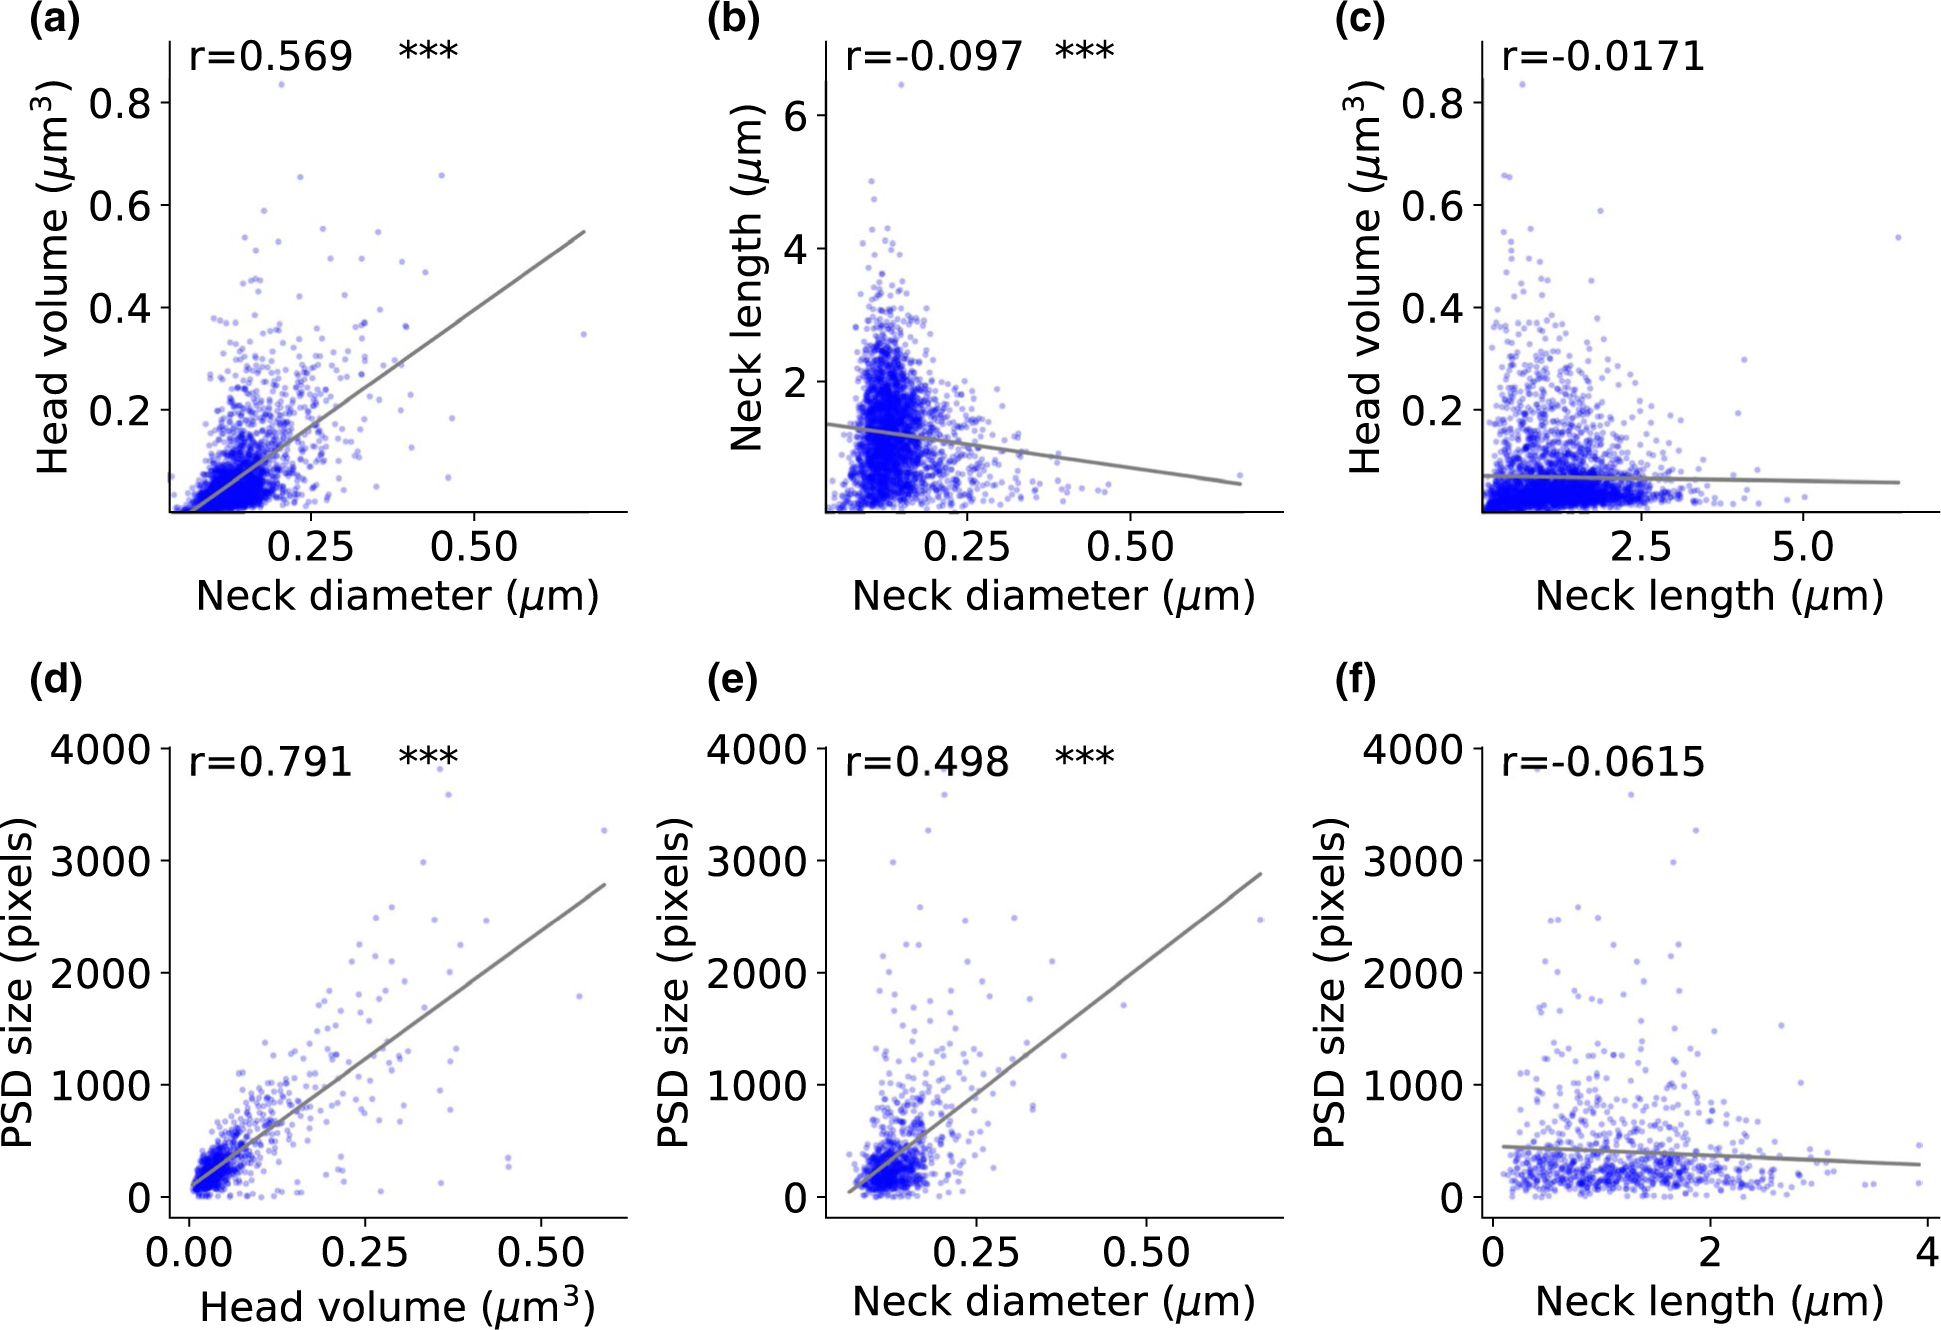
Correlation between spine head and neck morphological variables. (a-c) Correlation between head and neck morphologies (2,998 spines). (d-f) Correlation between head volume, neck length, and neck diameter and post-synaptic density size (888 spines). The correlation coefficients (Spearman) are indicated for each graph. The asterisks indicate statistical significance ***p < .001. Two-sided p-value for a hypothesis test whose null hypothesis is that the slope is zero, using Wald Test with t-distribution of the test statistic