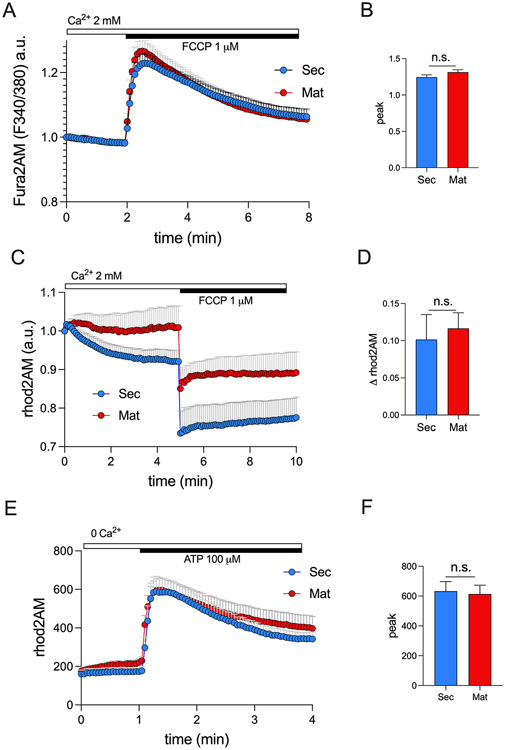
Figure 1: Quantification of mitochondrial Ca2+ dynamics in ameloblasts.
A) Original traces of secretory and maturation ameloblasts loaded with the cytosolic Ca2+ indicator fura2AM (1 μM) stimulated with FCCP (1 μM). B) Quantification of Ca2+ peak. C) Original traces of secretory and maturation ameloblasts loaded with the mitochondrial Ca2+ indicator rhod2AM (4 μM) stimulated with FCCP (1 μM). D) Quantification of rhod2AM delta (Δ). E) Original traces of secretory and maturation ameloblasts loaded with rhod2AM and stimulated with ATP (100 μM). F) Quantification of Ca2+ peak. For A, C and E, data represent the mean ± SEM of n = 6 independent experiments, 3 slides for each condition 20 - 100 cells per field. Data were analyzed by 2 - tailed unpaired Student’s t test. n.s., non-significant.

