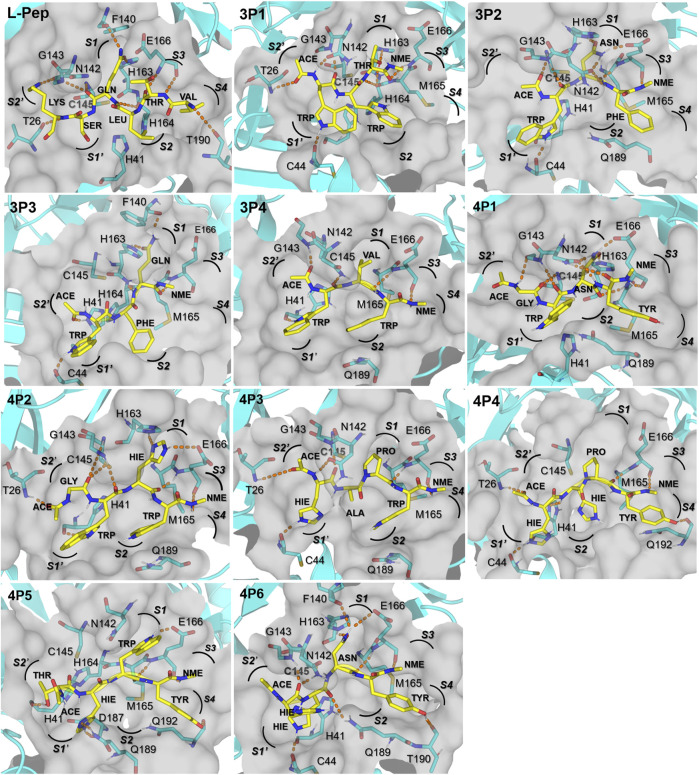
FIGURE 4.
Structural representation of top-ranked D-tripeptides and D-tetrapeptides in complex with 3CLpro. All D-peptides are shown as yellow sticks and their residues are labeled in bold and in the three-letter code. 3CLpro residues forming H-bonds with the peptides plus the catalytic residues H41 and C145 are labeled and represented as cyan sticks. The 3CLpro active site cavity is depicted as a transparent gray surface. H-bonds between the D-peptides and the 3CLpro residues with occupancies >25% during the respective 110 ns MD simulations are displayed as orange dashed lines. Subsites S4 to S2′ are labeled in bold and italic. Structural representations of the remaining D-peptides included in Table 1 can be found in Supplementary Figure S5.

