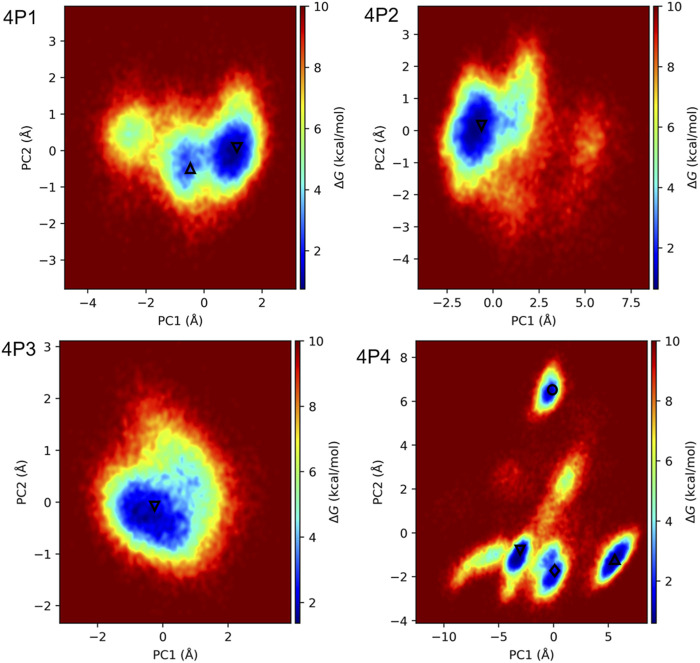
FIGURE 6.
FEL heatmaps for 3CLpro in complex with 4P1, 4P2, 4P3, and 4P4. FELs were obtained by projecting the concatenated replicate 1 μs trajectories of the complexes onto PC1 and PC2, associated with the motions of the D-peptide Cα atoms. All trajectories were fitted to the respective initial structures with respect to the backbone atoms of 3CLpro in the ChT-like domains. The local energy minima observed in the heatmaps are indicated with the symbols Δ, ∇, ◊, and ○, which rank the minima according to their relative sizes in decreasing order (Δ > ∇ > ◊ > ○). PC1 and PC2 were chosen to generate FELS because they account for more than 68% of the motions of the D-peptide Cα atoms in all cases (Supplementary Figure S10).

