
Fig. 11 |. SPR binding assays.
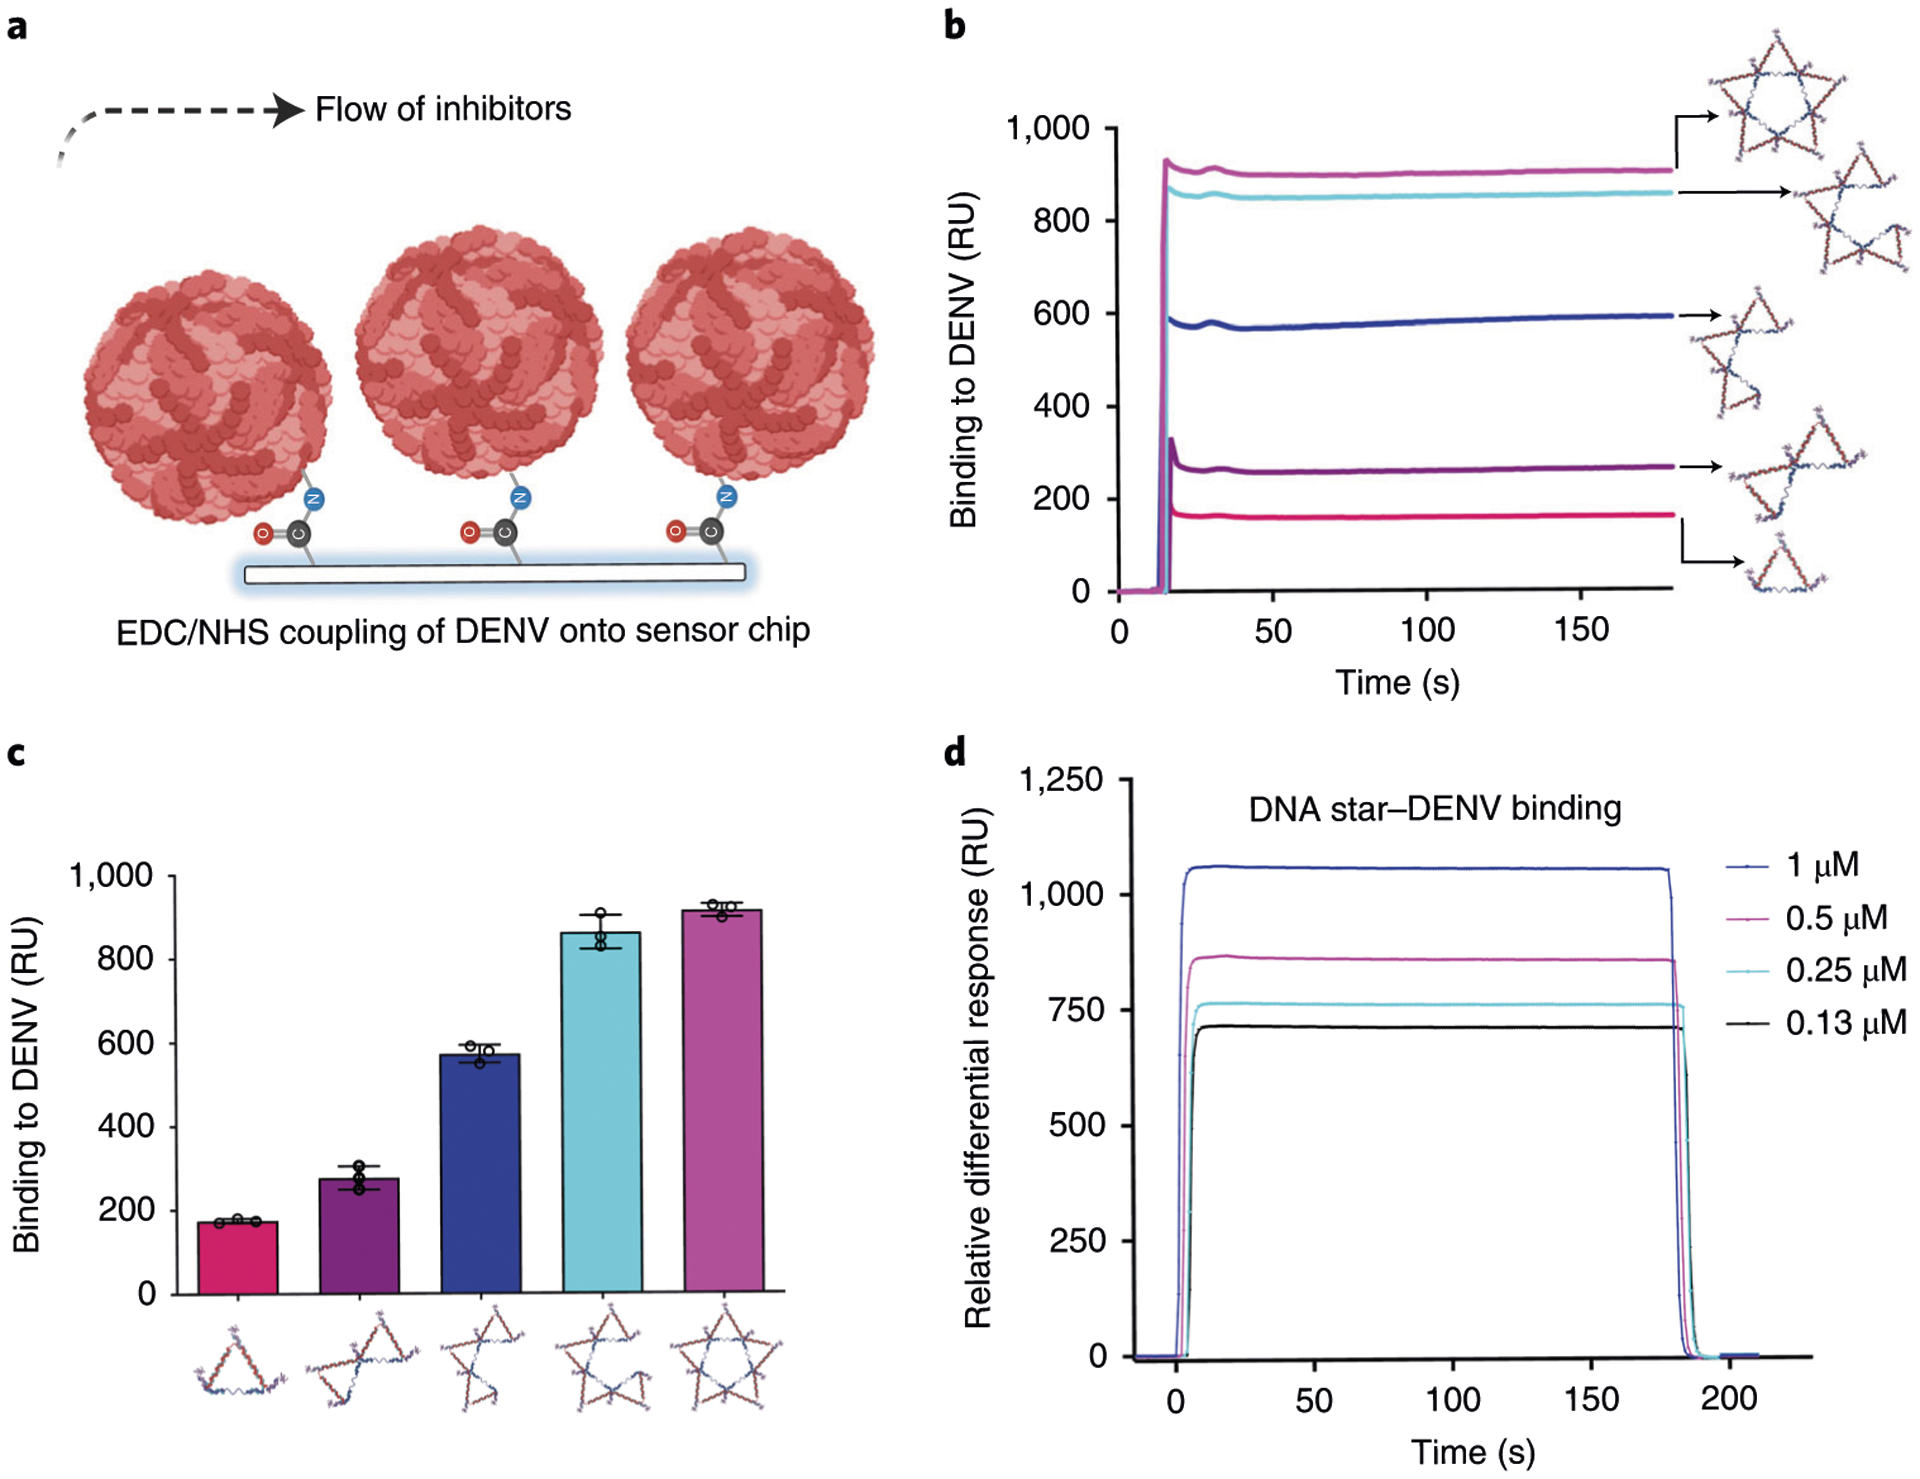
a, Schematic of the SPR binding assay used to determine the binding avidity of the DNA star and DENV particles. b,c, Binding avidity comparison of one-triangle, two-triangle, three-triangle, four-triangle or full star–aptamer complex and DENV particles. Higher-degree pattern matching (by increasing the number of points of the star to better match the ED3 geometry) leads to stronger binding avidity. b shows exemplar response curves. Error bars are mean ± s.d., n = 3 biologically independent samples in c. d, Dissociation constant (KD) measurement of the DNA star when binding to DENV particles is calculated by globally fitting the entire association and dissociation phases using 1:1 Langmuir binding model from BiaEvaluation software 4.0.1. (GE Healthcare, Uppsala, Sweden). d shows exemplar response curves. Figure adapted with permission from ref.7, Springer Nature Ltd.