
FIGURE 1.
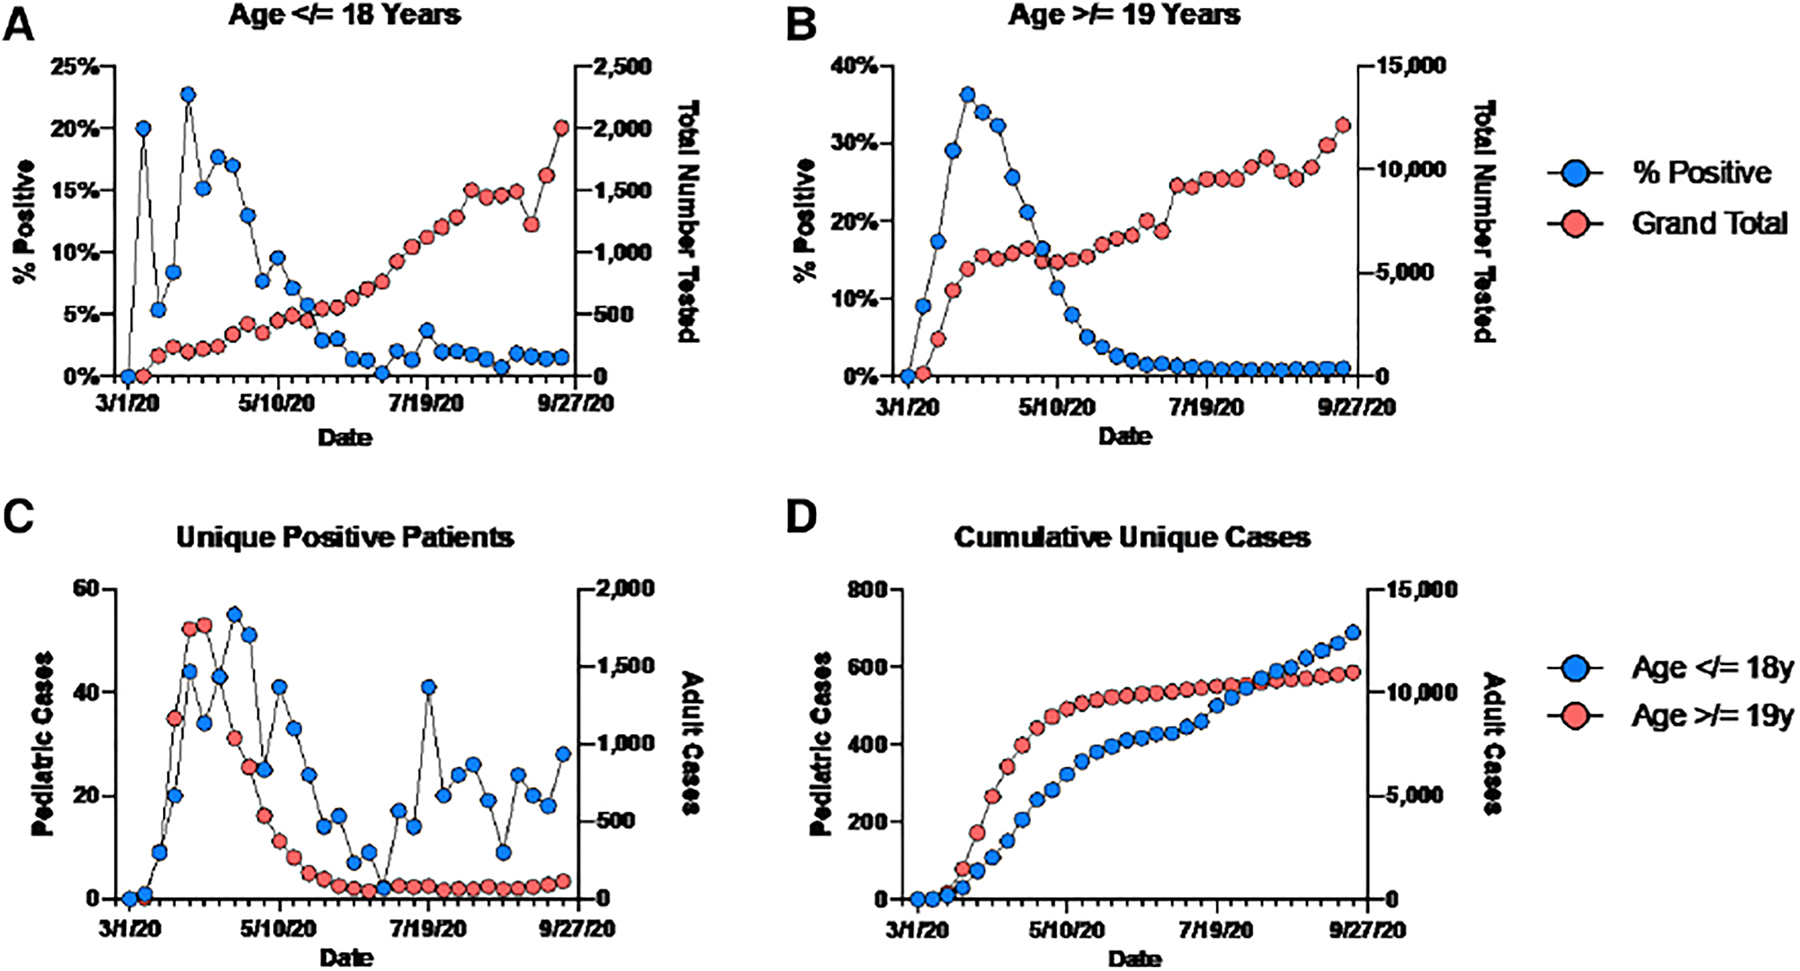
SARS-CoV-2 testing parameters over time. Total tests performed and the %-positivity are shown for children (A) and adults (B) from March to September. C: Unique positive patients and (D) cumulative positive patients by age are shown by week. The date shown is the first day of the week, and tick marks denote individual weeks.