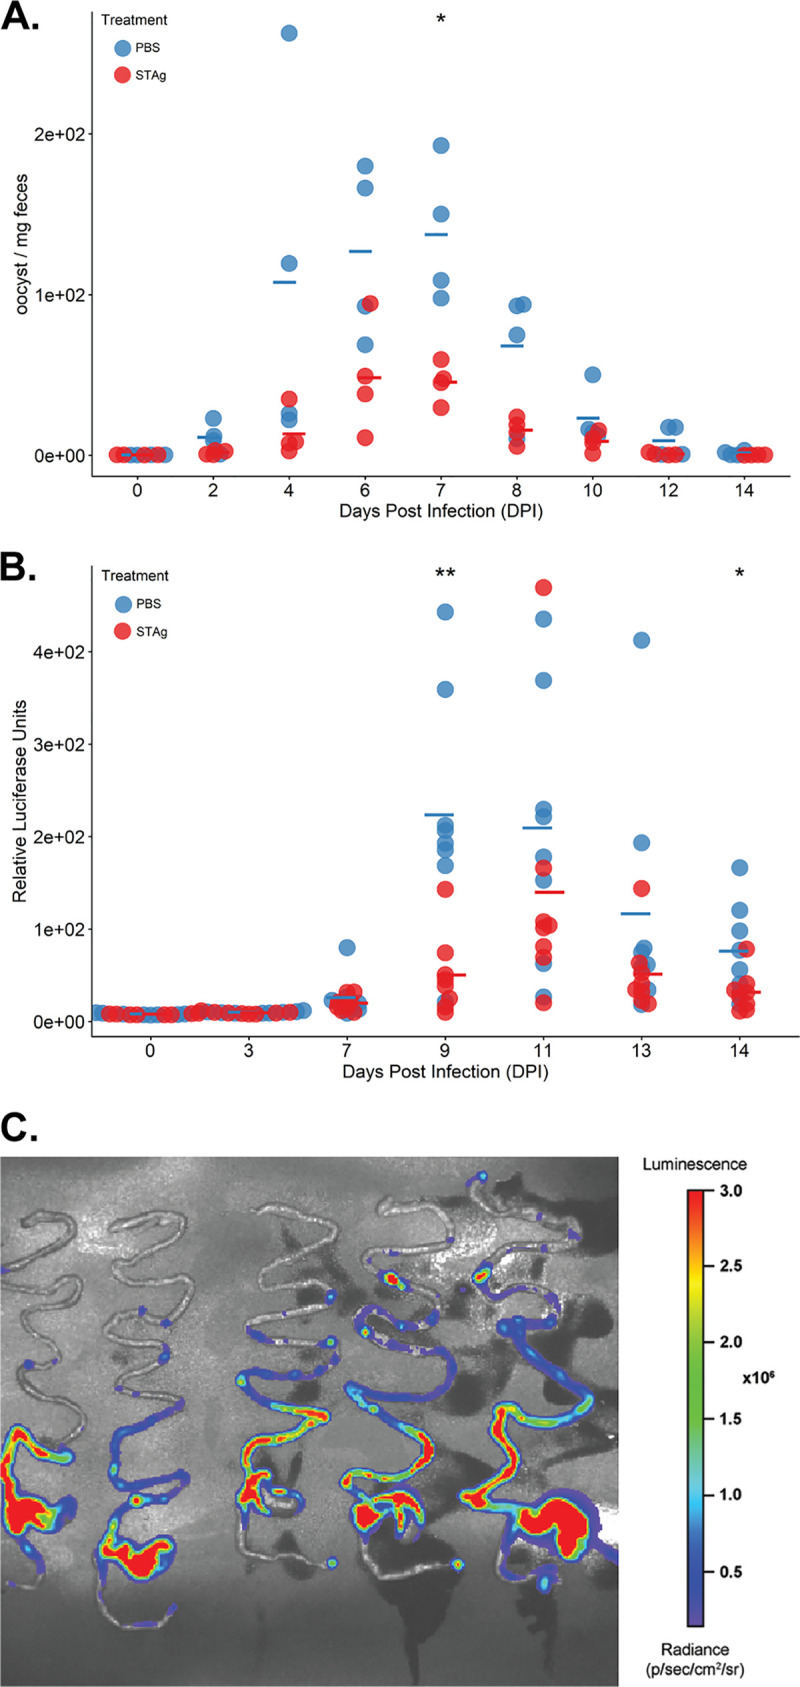
FIG 1.

Infection time course of C. parvum infected mice treated with STAg or PBS. (A) Oocyst shedding per dpi in experiment 1 over 14 dpi. *, P = 0.020. Oocyst shedding was calculated by qPCR, as described in Materials and Methods. (B) Oocyst shedding per dpi in experiment 2 over 14 dpi. **, P = 0.0058; *, P = 0.0457. Oocyst shedding was calculated by expression of Nluc, as described in Materials and Methods. Each circle represents a mouse. Open circles, uninfected animals; filled circles, infected animals. Statistic differences were determined using R with analysis of variance (ANOVA). The mean for each group is represented by a line. (C) Bioluminescent imaging of C. parvum in IFN-γ-KO mice throughout the intestinal tract: the intestinal tracts of mice infected for 9 days with Nluc-expressing C. parvum Iowa II strain at 1 × 10⁵ showed a higher signal in the ileum and cecum than the duodenum, jejunum, and colon. The radiance scale is shown.
