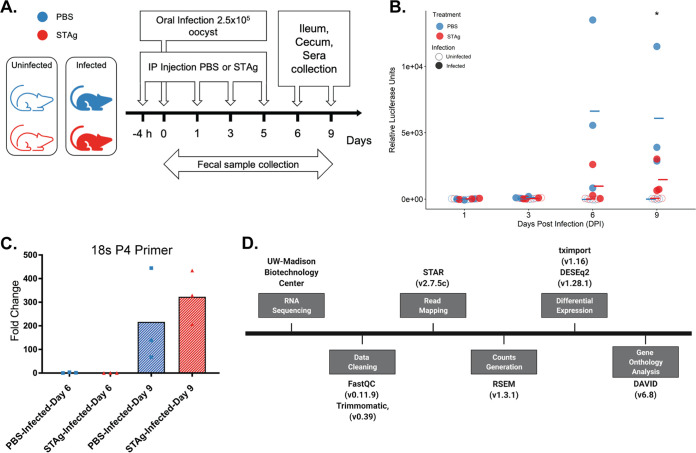
FIG 2.
Mouse experiment design and analysis for RNA sequencing. (A) For the RNA-seq analysis, 12 mice (6 infected and 6 noninfected) were treated with PBS or STAg. The treatment was administered 4 h before infection (2.5 × 10⁵ Nluc-expressing C. parvum Iowa II strain oocysts by oral gavage) and 1, 3, and 5 dpi. Fecal samples were collected every other day, and the infection was quantified by Nluc expression. IFN-γ-KO mice were euthanized on 9 dpi, and ileum and cecum samples were collected. (B) Oocyst shedding per dpi in experiment 3 over 9 dpi. Oocyst shedding was calculated by expression of Nluc, as described in Materials and Methods. Significance was determined using R with ANOVA, with P = 0.049. The mean for each group is represented with a line. (C) Relative quantification of C. parvum by qPCR using 18S rRNA primers P4 normalized to mouse GAPDH in ileum samples. Values are means from two independent experiments. Fold change was calculated relative to the reference PBS-infected group at day 6. Significance was determined using R with ANOVA. **, P = 0.0079 (infected STAg treated, day 6 versus day 9). Each circle represents a mouse. (D) RNA sequencing analysis flowchart listing the programs and packages used for reading and analysis.

