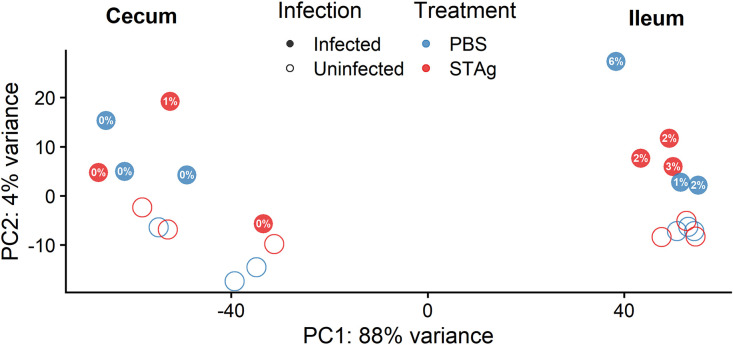
FIG 3.
PCA of ileum and cecum samples. PCA plot from normalized values calculated by DESeq2. Mapping of the cecum and ileum to the Mus musculus genome. Percentages in filled circles correspond to percentages of reads uniquely mapped to the C. parvum Iowa II genome up to one significant figure; for more detailed mapped percentages, see Table S1.

