
Figure 2. RNA sequencing (RNA-seq) of skeletal muscles undergoing atrophy induced by dexamethasone, LLC cancer cachexia, and aging reveals stimulus-specific transcriptional signatures of atrophy.
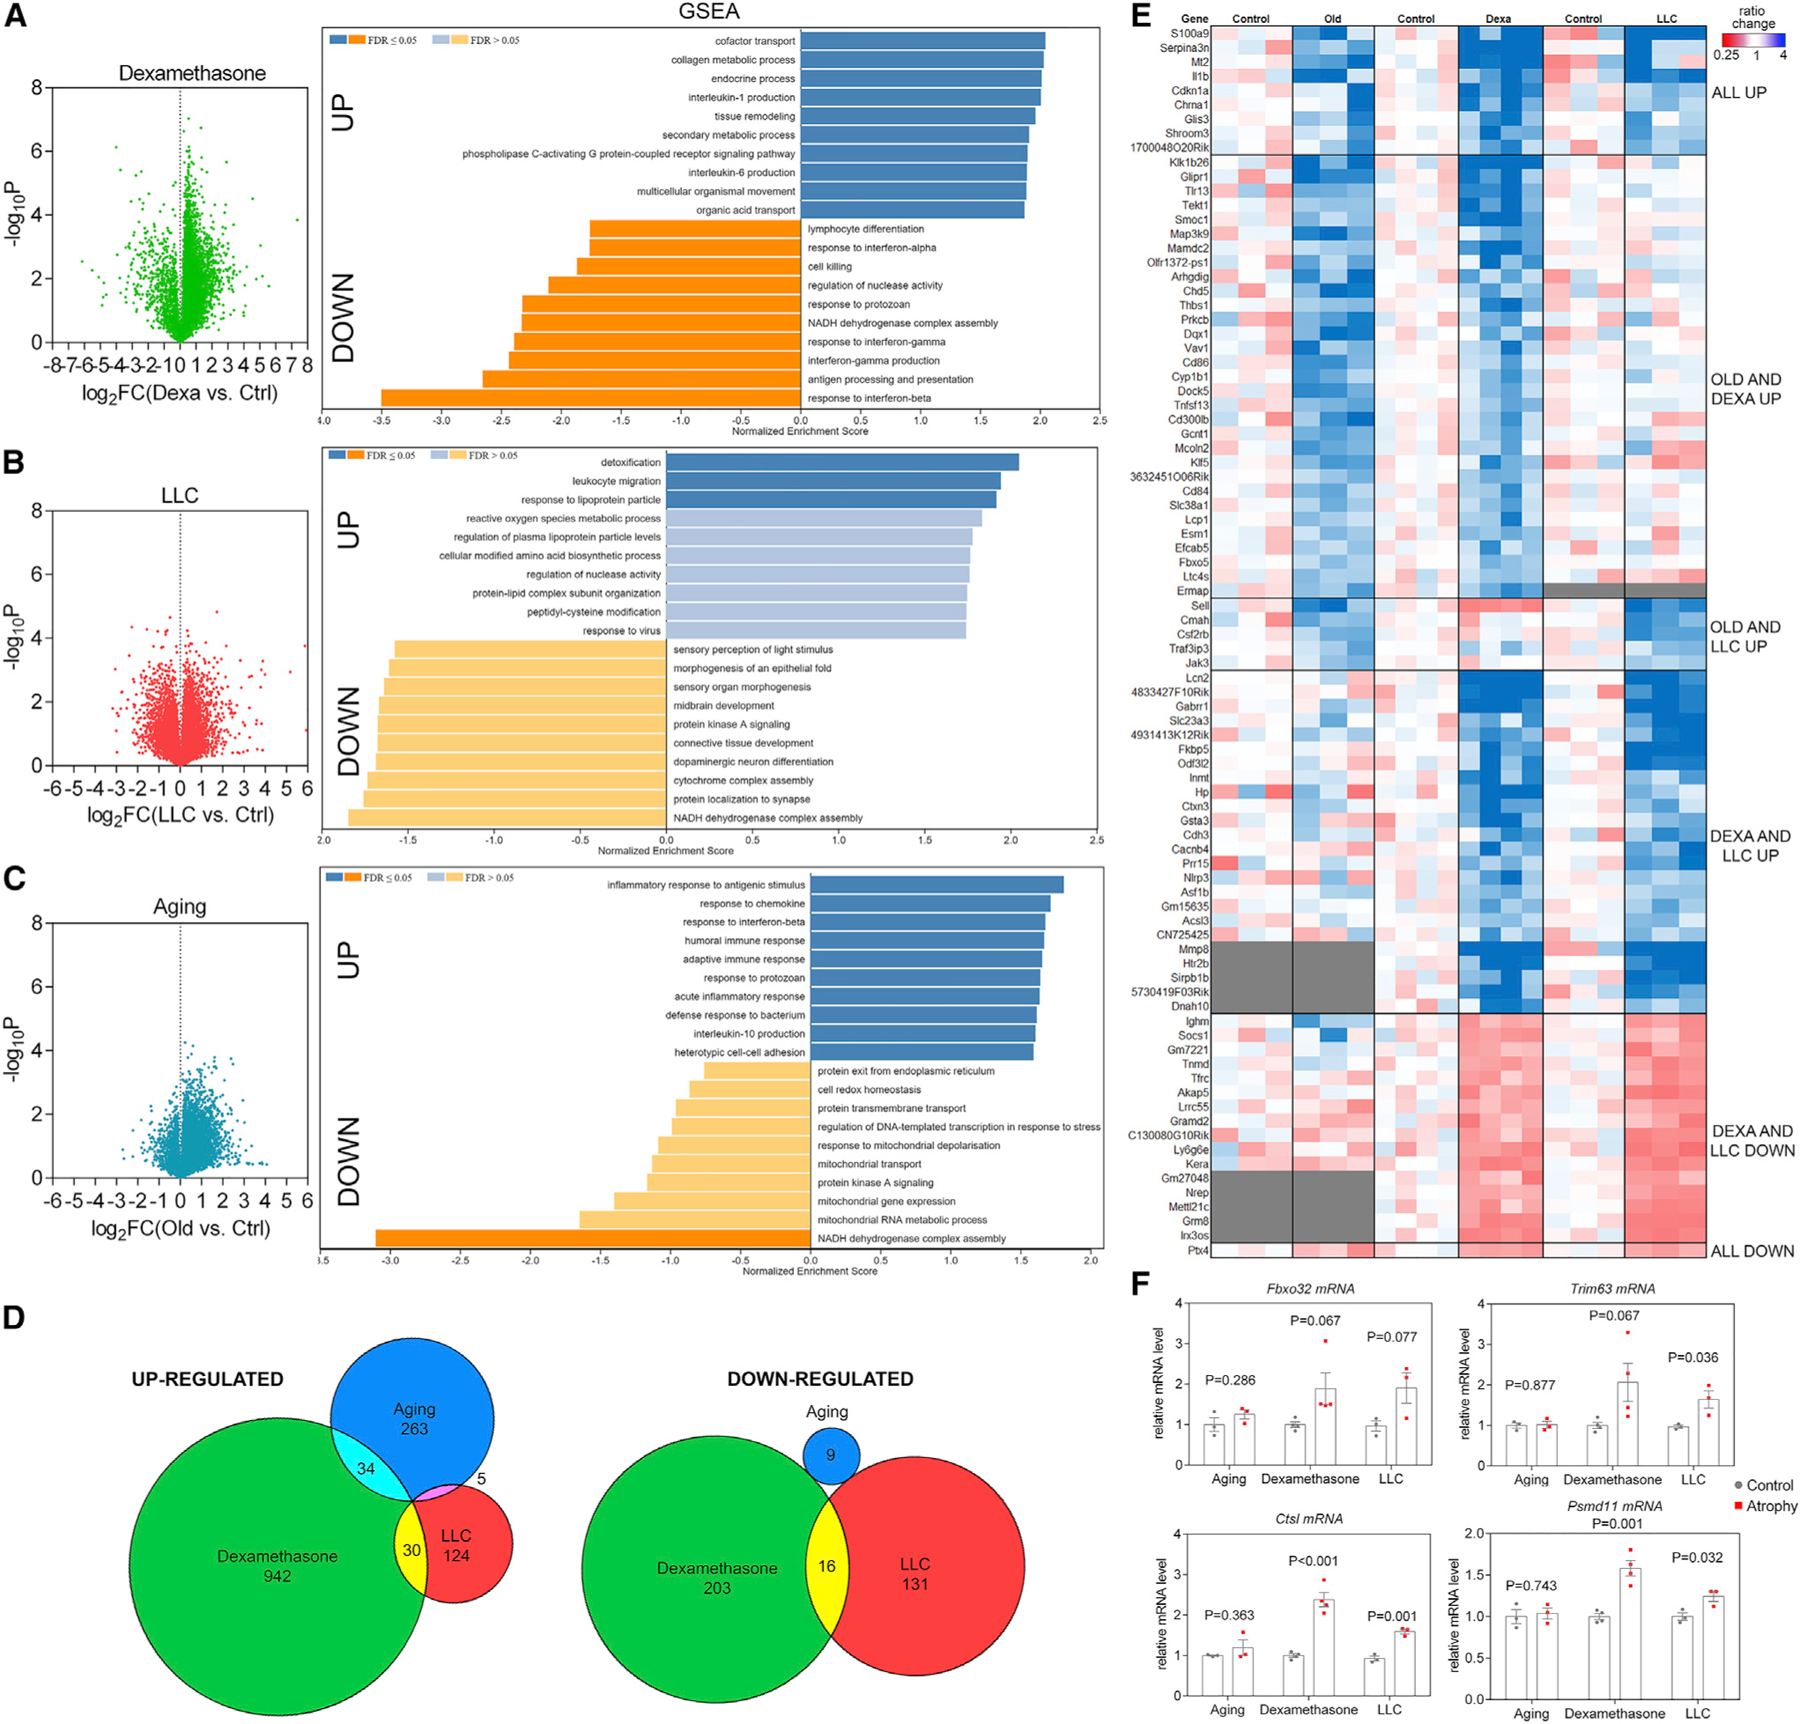
(A–C) Volcano plots of RNA-seq data and GSEA from TA muscles from (A) dexamethasone, (B) LLC cancer cachexia, and (C) aging.
(D) Comparison of significantly regulated mRNAs (p < 0.05 and log2FC > 1 for upregulated and log2FC < −1 for downregulated mRNAs) in distinct modes of myofiber atrophy.
(E) Heatmap of the genes that met the criteria above and shared overlap with at least 2 modes of atrophy. Genes up- and downregulated in all modes of atrophy (denoted as “all up” or “all down”) met changes in magnitude criteria but not p value criteria for all 3 modes.
(F) Atrogenes previously described as mediators of atrophy are not regulated in all modes of atrophy.