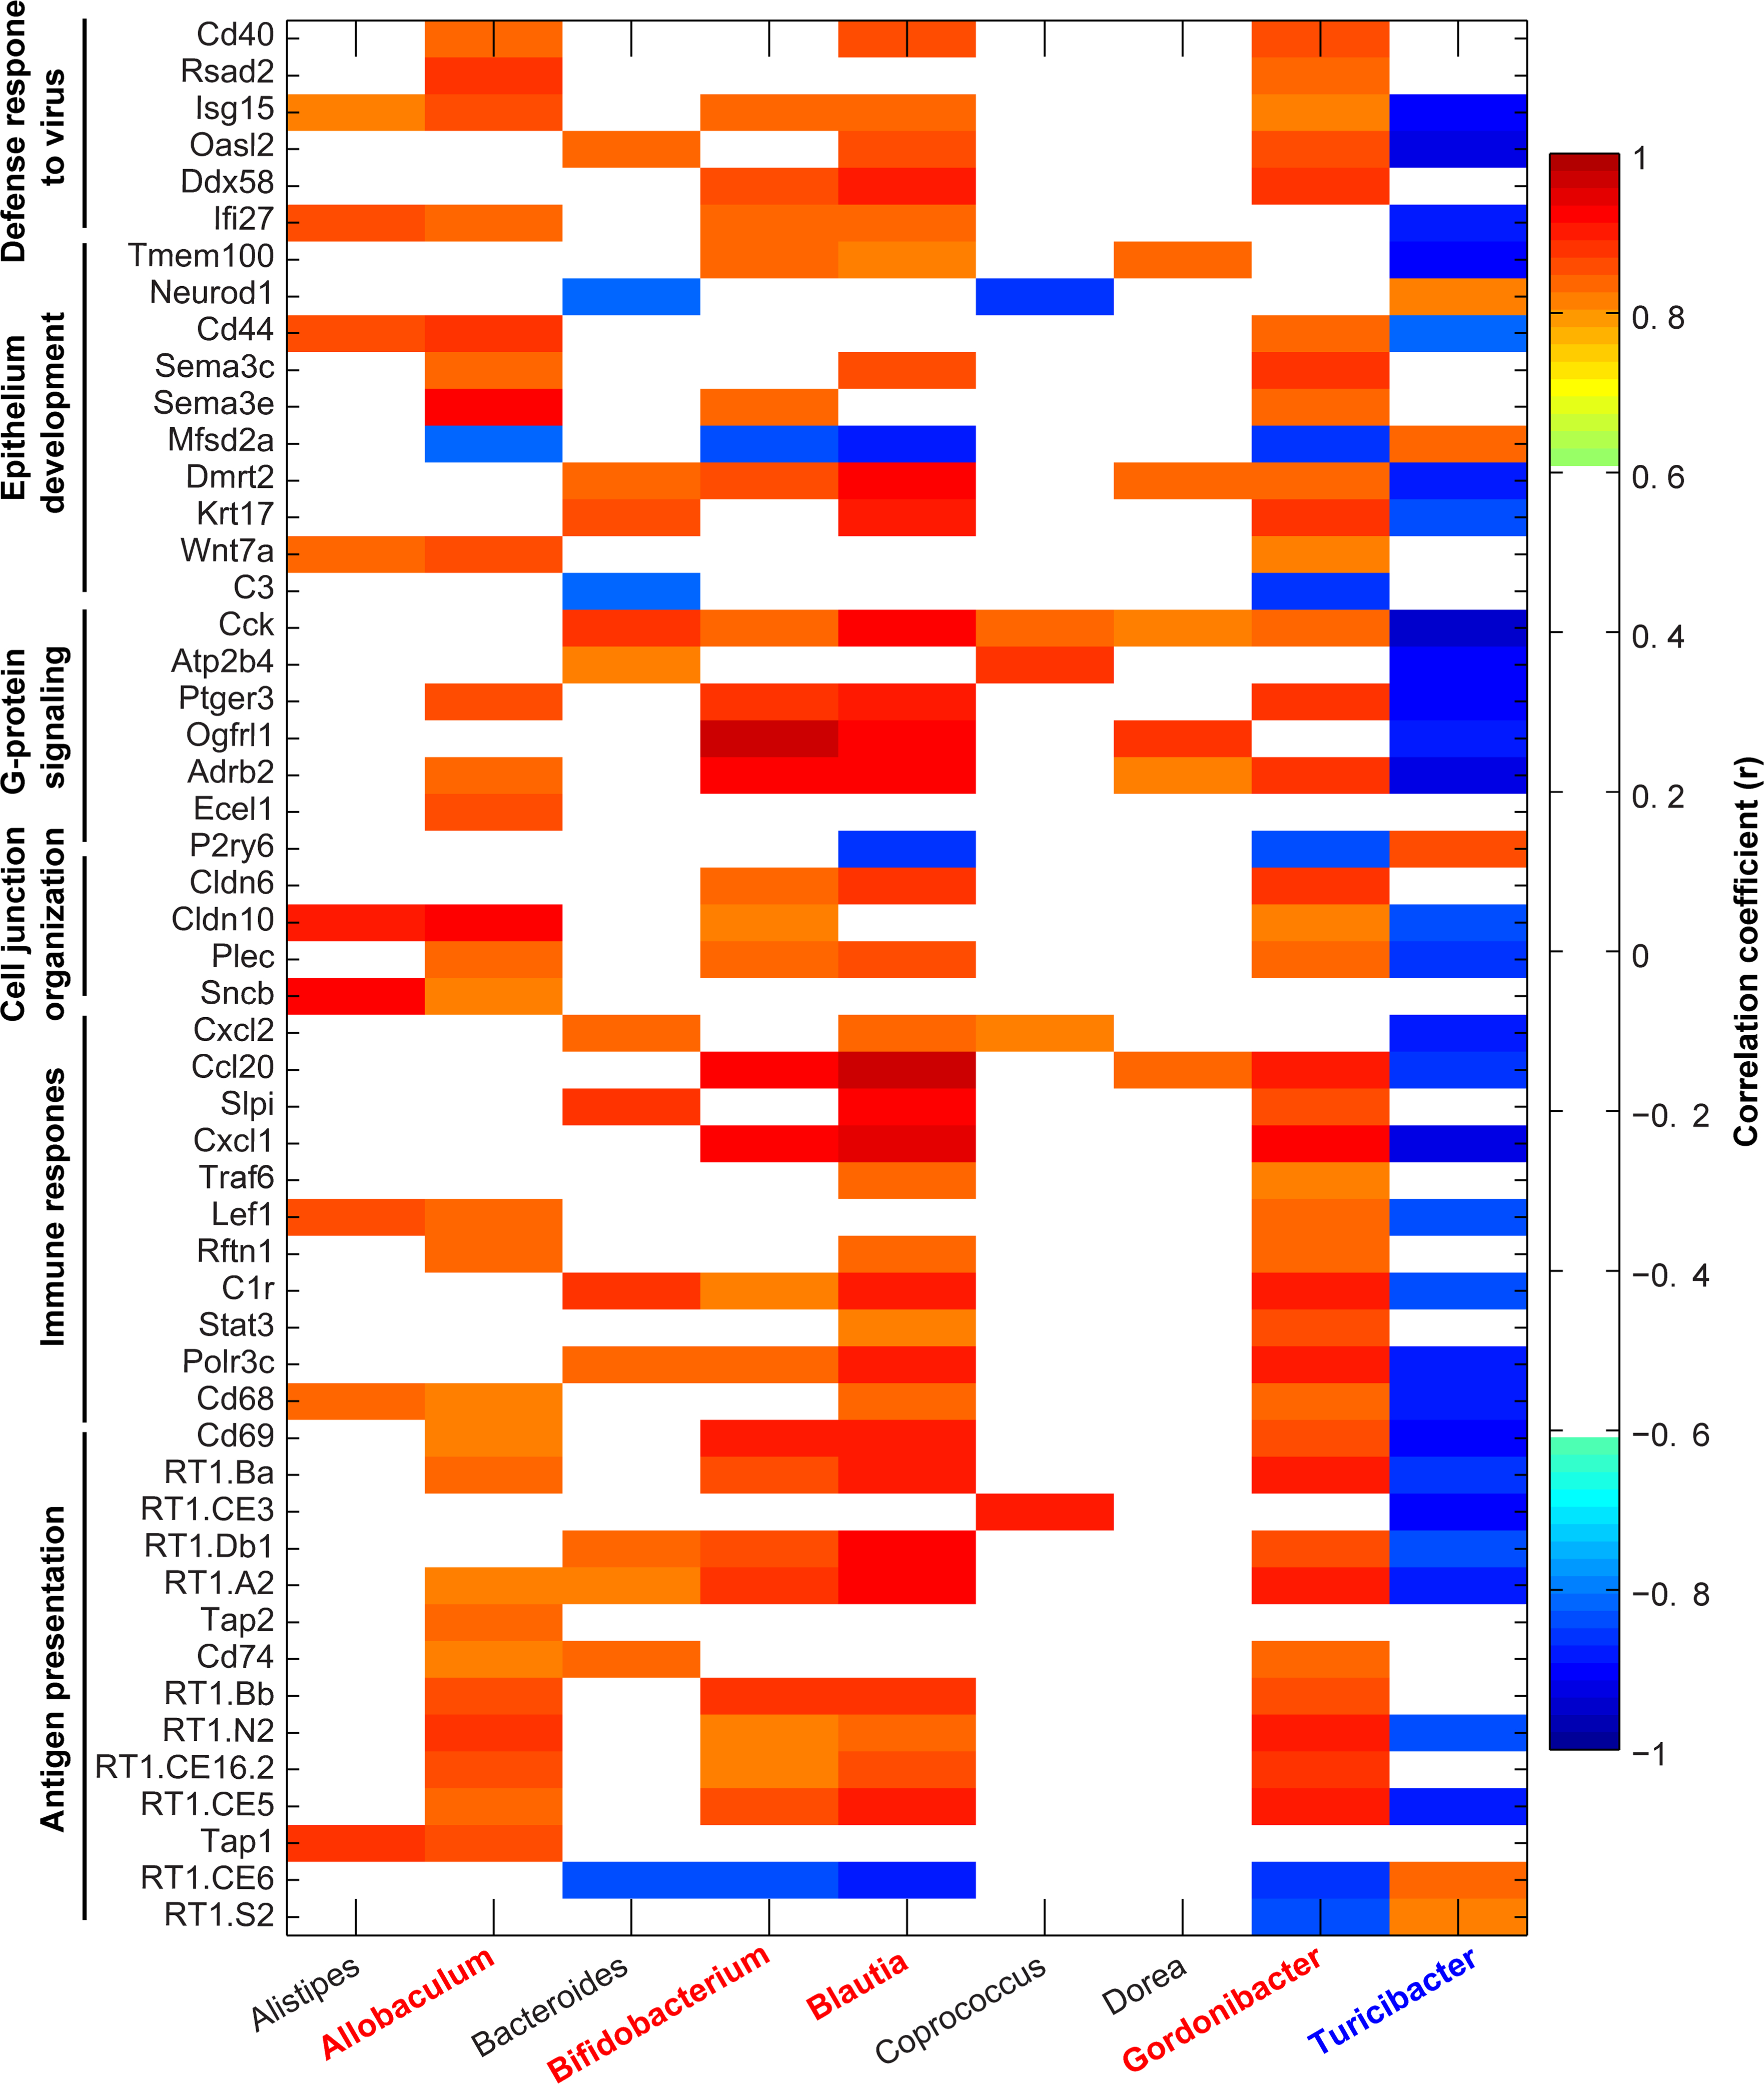
Figure 4. Alteration of gut microbiota composition correlates with gene expression for functional gene sets in gut epithelium of WKY rats and SHR.

Correlation analyses were performed on the normalized abundance of bacterial genera data (3) and gene expression values from RNA-seq data(8). Pearson’s correlation coefficients (r) were generated for all samples regardless of group using MATLAB software with a cutoff value of 0.811 (n = 5, p < 0.05) and displayed using pixel maps. Red-highlighted genera are positively correlated, and blue-highlighted genera are negatively correlated.
