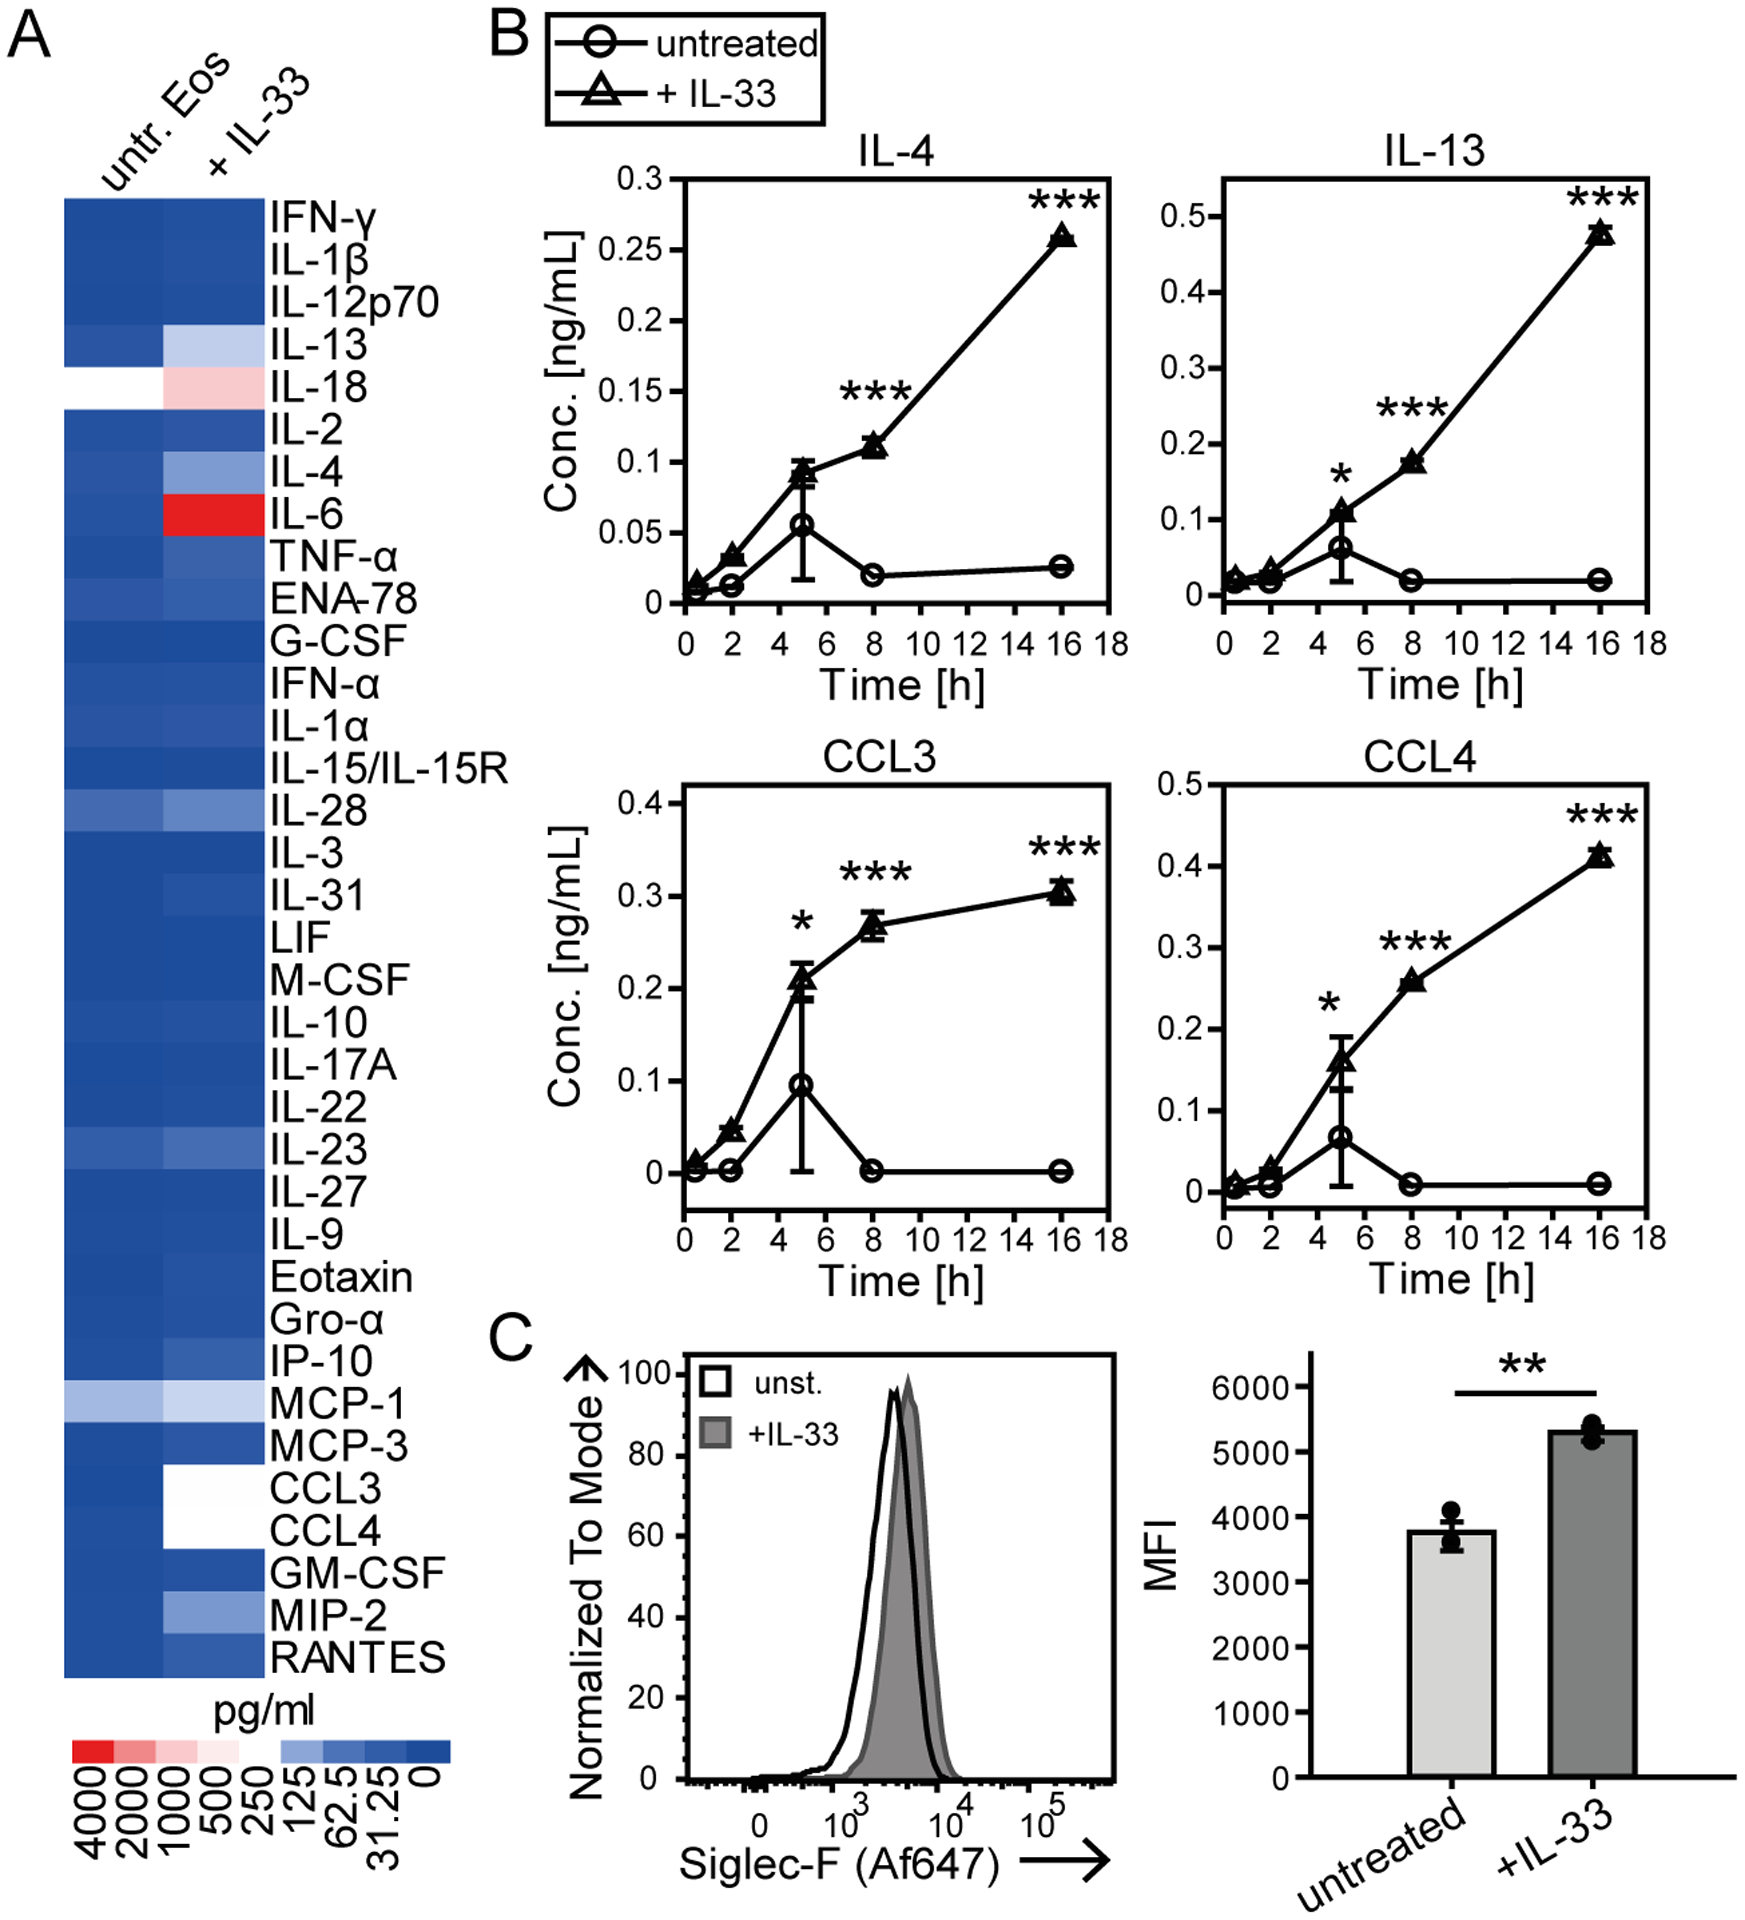
Figure 1: IL-33 activates eosinophils to release cytokines and chemokines and increase their surface expression of Siglec-F.

A, B) Multiplex cytokine assay screen from the supernatants of d14 BMDE cultures stimulated with IL-33 and their unstimulated controls. Data were obtained from one BMDE culture in technical duplicates. A) An overview of the 35 analyzed cytokines is displayed as a heatmap for 8 hrs of stimulation. B) Time course analysis for the release of selected cytokines over the course of 0.5, 2, 5, 8 and 16 hrs of stimulation with IL-33 or of unstimulated cultures. C) Siglec-F surface expression on d14 BMDE cultures. Displayed are representative histograms of one culture and the mean fluorescence intensity (MFI) of pooled data from three biological distinct cultures after 6 hrs of IL-33 stimulation or for unstimulated controls. For B) Significance was determined by Two-way ANOVA with Holm-Sidak post-hoc test and is indicated for significant differences between unstimulated and IL-33 stimulated BMDEs of the same time point. For quantification in C) data are displayed as the mean ± SEM and a t-test was performed with significance levels of *p < 0.05; **p < 0.01; ***p < 0.001.
