
Figure 2:
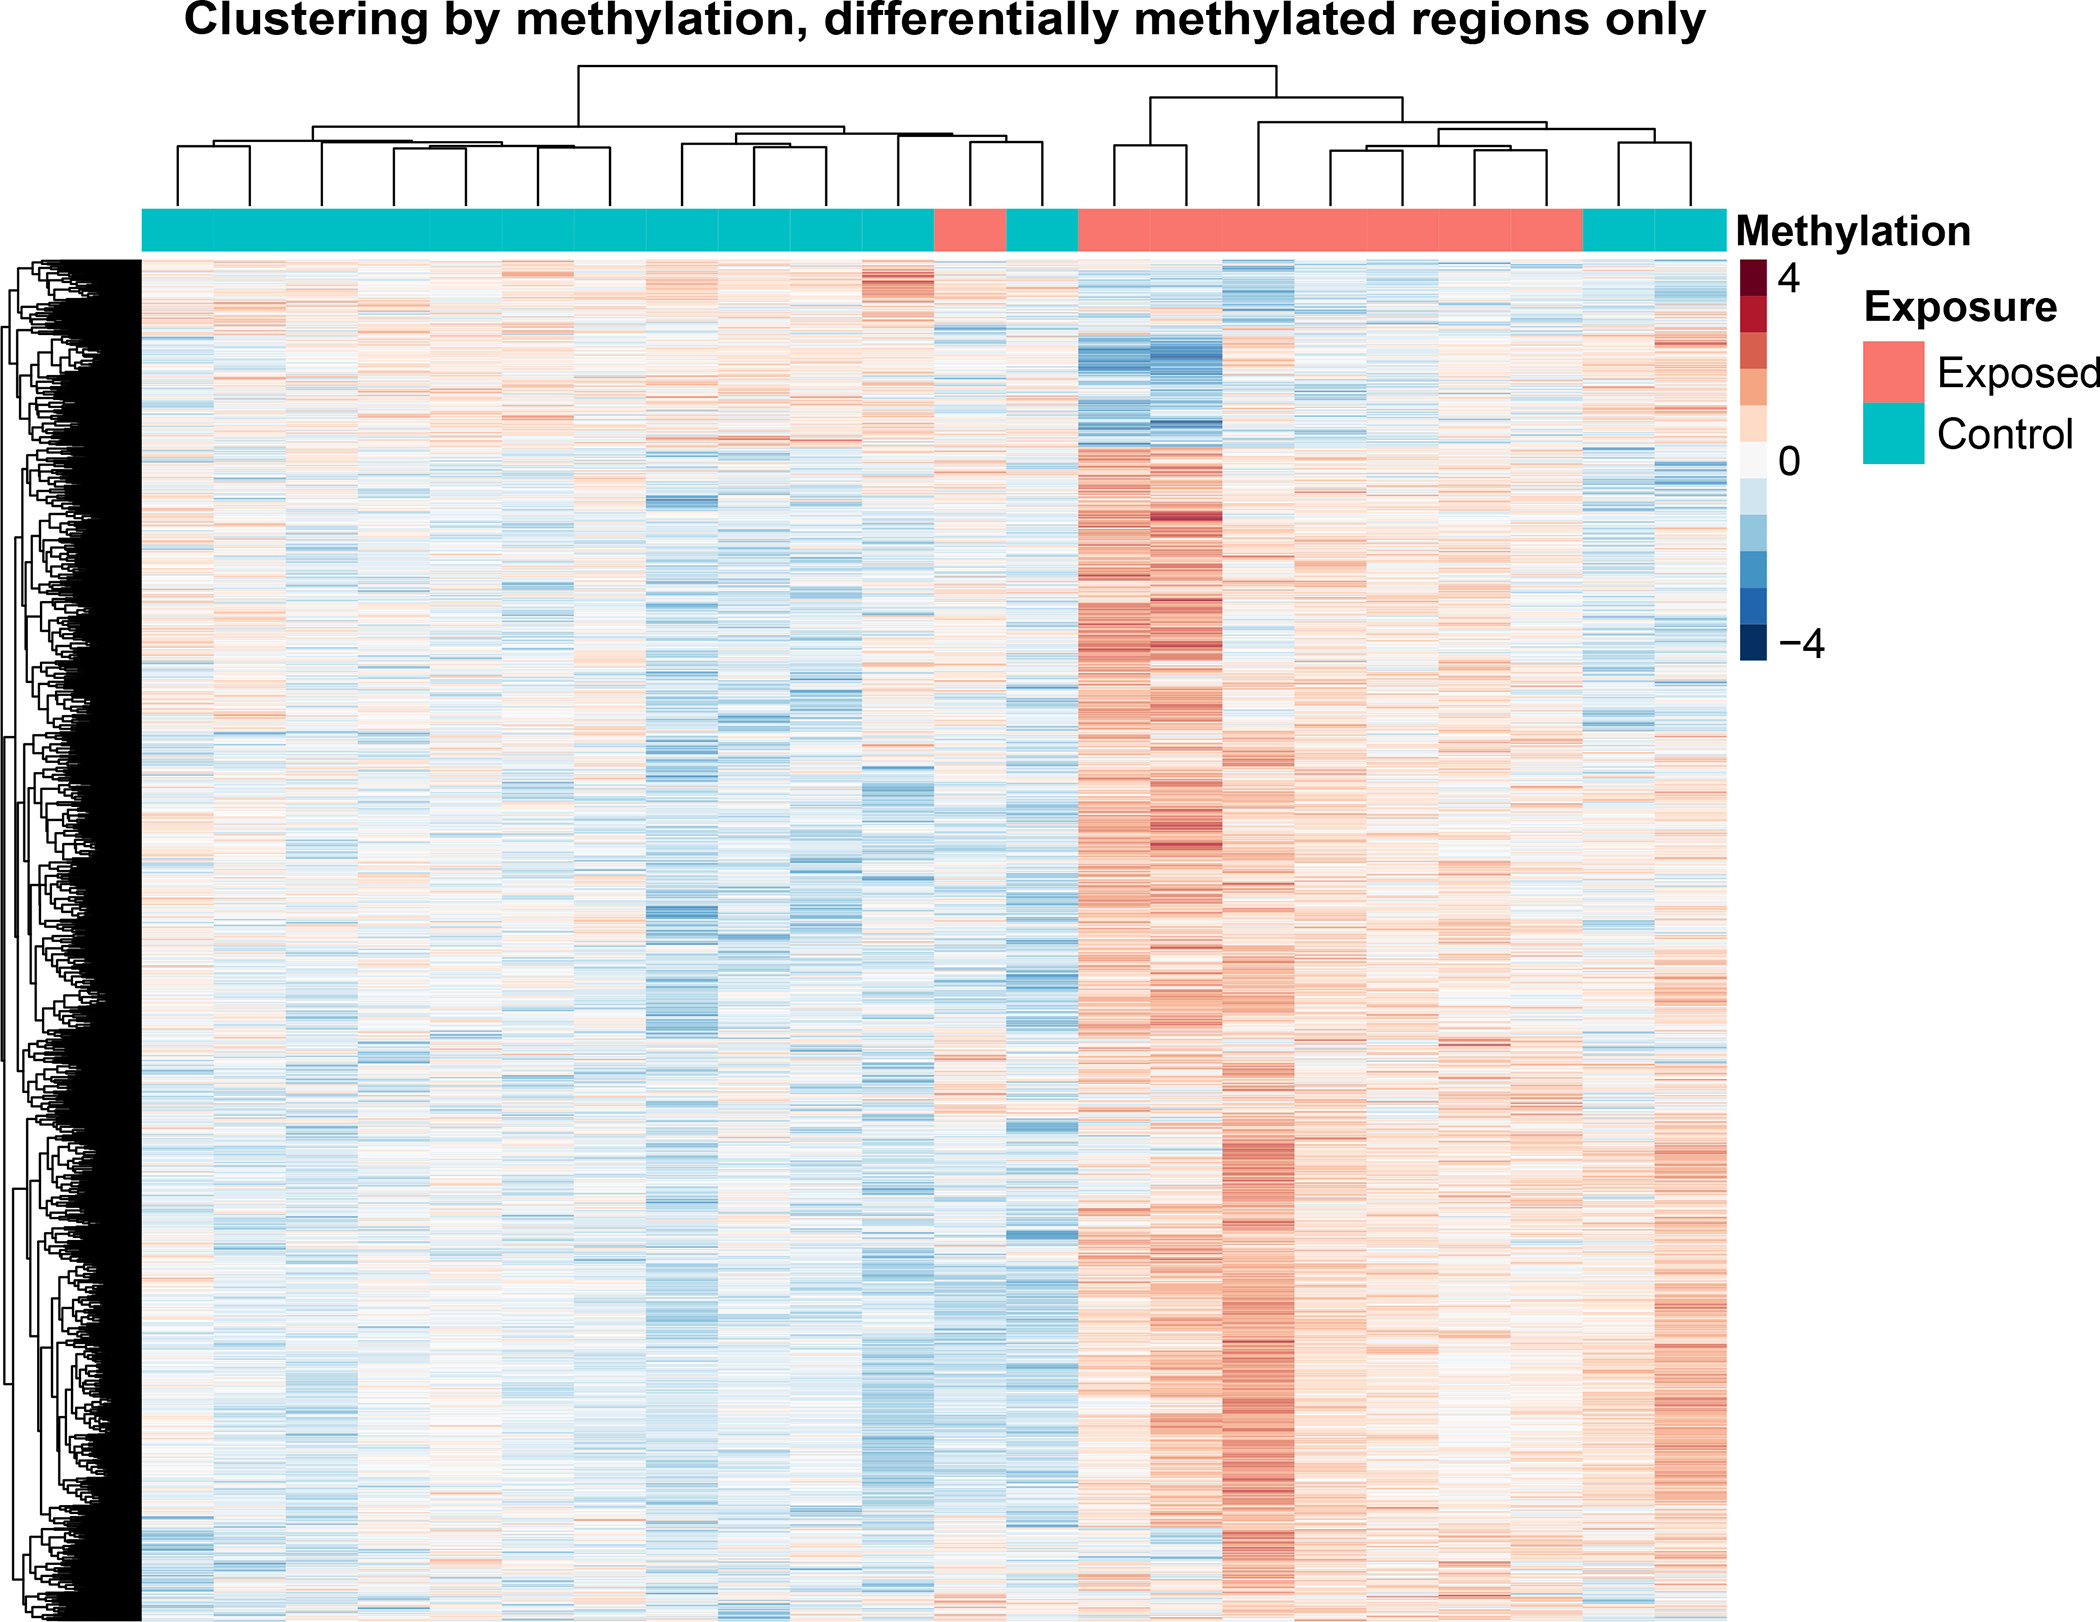
Heatmap showing sample clustering based on methylation. The heatmap includes only differentially methylated regions (DMRs). The heatmap was normalized on a per row basis for visualization, therefore the values on the scales are relative rather than absolute.