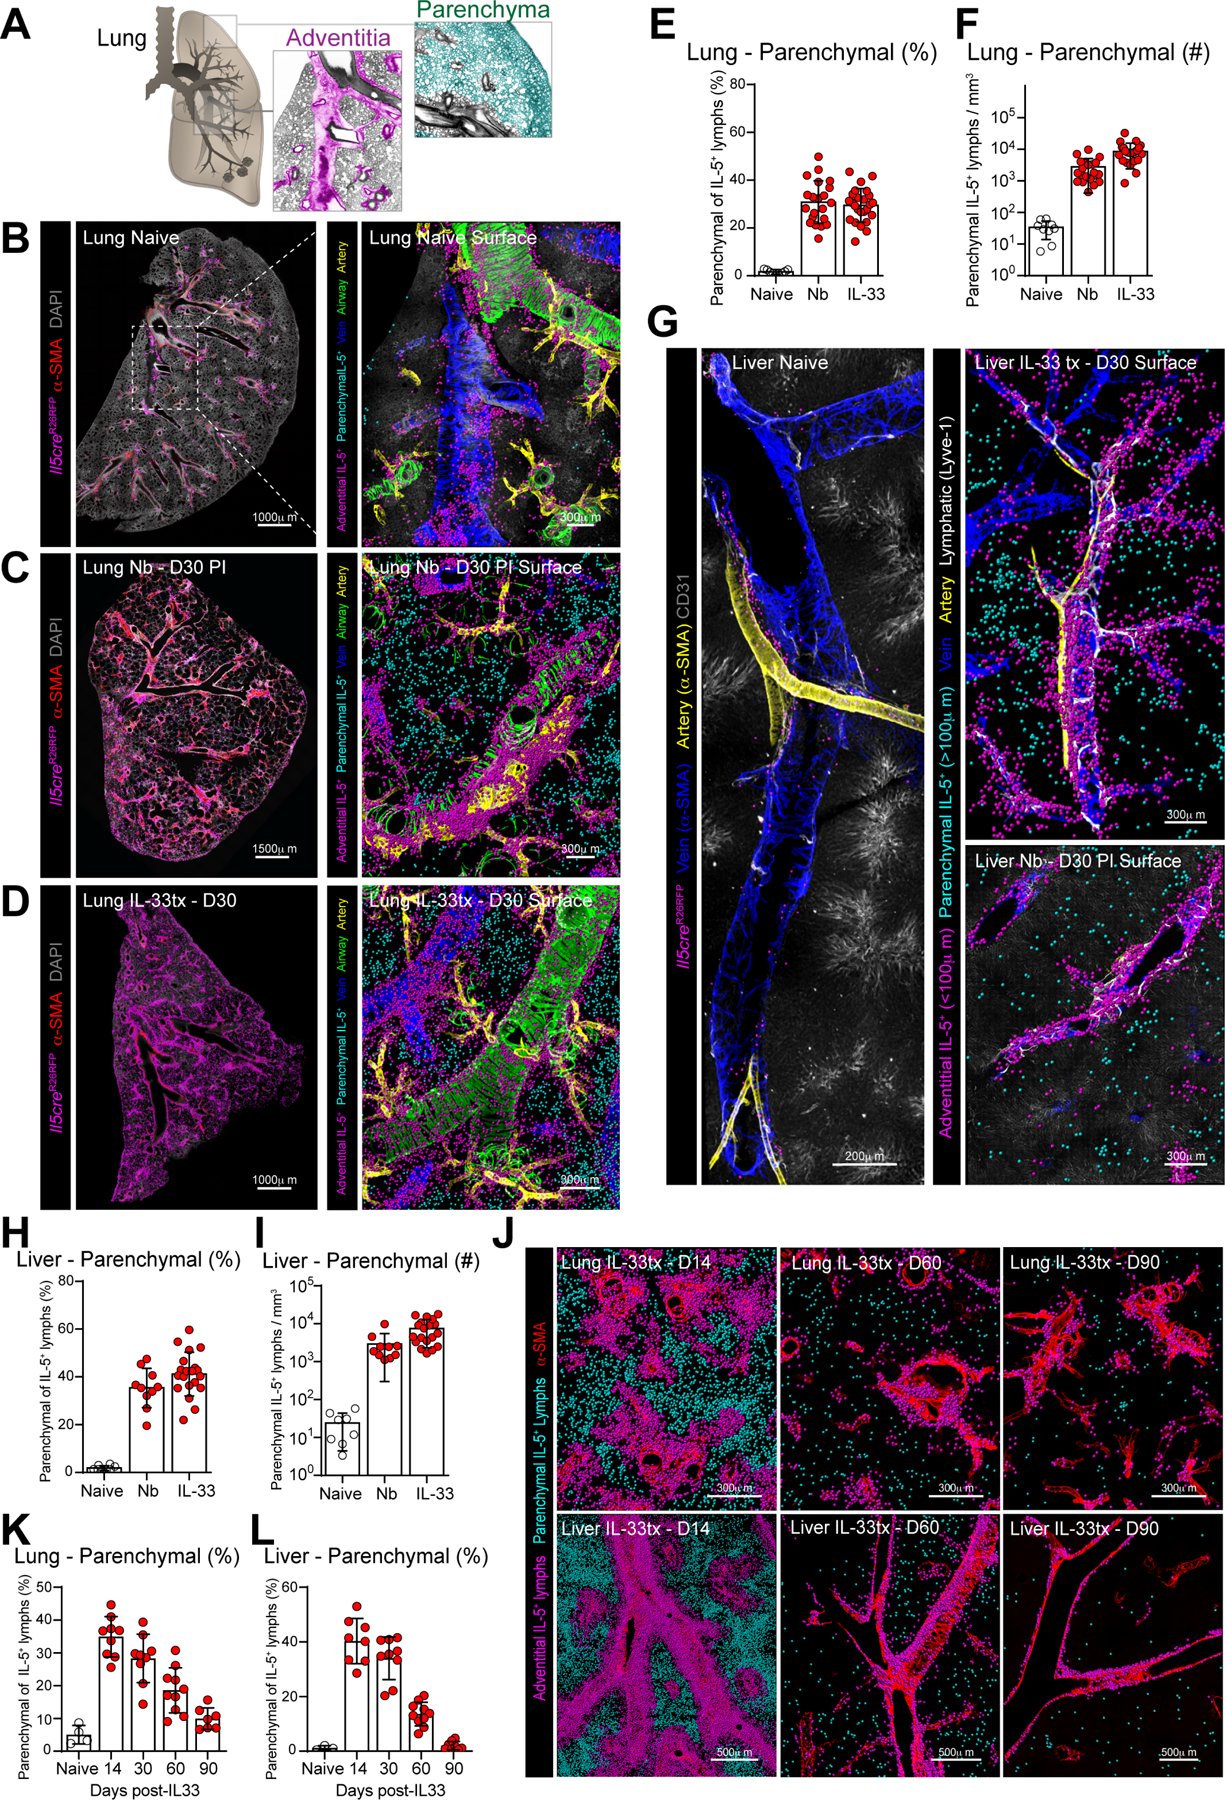
Figure 1: IL-5+ type 2 lymphocytes expand in lung and liver parenchyma during type 2 inflammation.

(A) Schematics of lung topography highlighting adventitial (pink) and parenchymal (teal) domains.
(B-D) Confocal imaging of lung thick-sections (left) or surface-rendered three-dimensional reconstruction (right) from IL-5+ T2L lineage tracker naïve mice, Nippostrongylus brasiliensis infected (Nb) at day 30 (D30) post-infection (PI), or IL-33 treated at D30 post treatment, as indicated. 3 independent experiments, total N=5–6 mice/group.
(E-F, H-I) Quantitative analysis of lung and liver thick-section confocal images as percent parenchymal IL-5+ T2Ls of total IL-5+ T2Ls (E and H) or parenchymal IL-5+ T2L numbers per tissue volume (F and I). Pooled from 3 independent experiments, total N=5–6 mice/group.
(G) Confocal imaging of liver thick-sections at resting, D30 PI with Nb and D30 post IL-33 treatment showing surface-rendered reconstruction, as described in B-D.
(J-L) Confocal imaging of lung and liver sections at indicated days post IL-33 treatment showing surface-rendered 3D reconstruction, as described in B-D and quantitative imaging analysis (K-L) of parenchymal IL-5+ T2L accumulation as a percent of total IL-5+ T2L. Images and quantification from 2 independent experiments, total N=4–5 mice per time point.
See also Figure S1.
