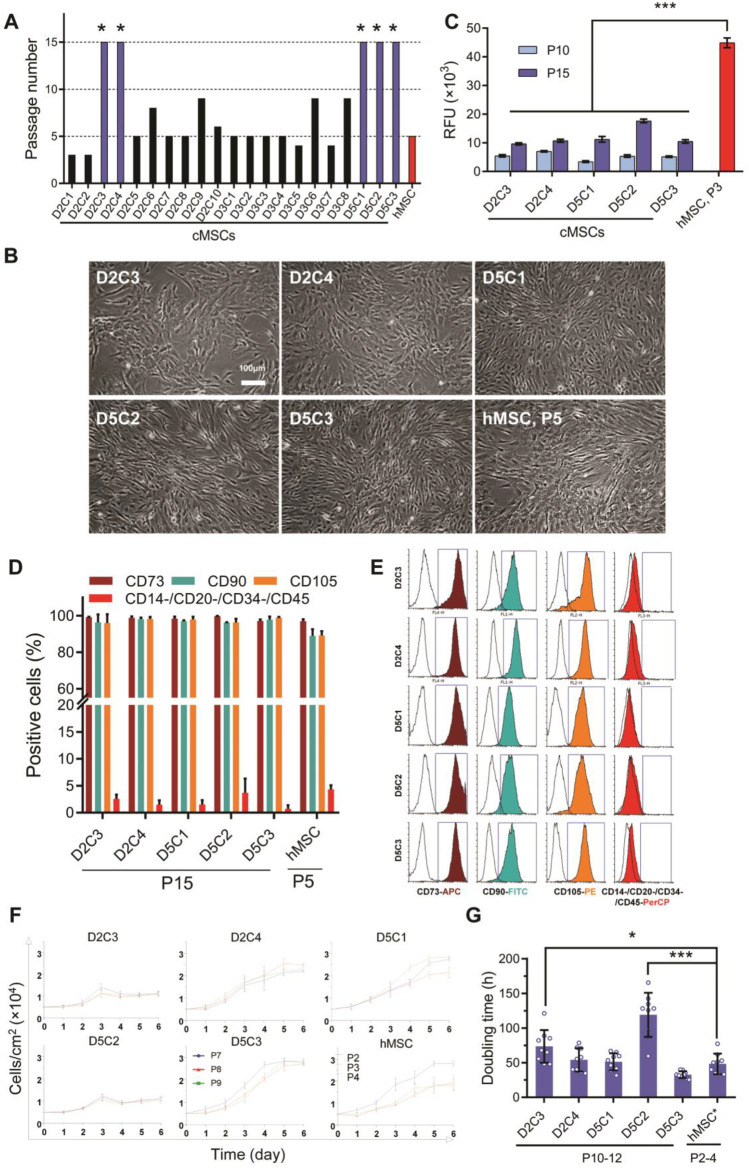
Fig. 1.
Clone selection based on long-term proliferation ability and MSC-related criteria. A Bars represent long-term serial passaging of the different clones derived from 2 ml of aspirated BM. As shown in the chart, 5 out of 21 clones reached P15 (*). B Cell morphology of selected cMSCs at P15 and their counterpart hMSCs at P5. C Senescence was evaluated by measuring senescence-associated β-galactosidase (SA-β-GAL) activity and expressed as relative fluorescence units (RFU) of the same number of cultured cells. Data are expressed as mean ± SD of six replicates. Statistically significant difference compared with the hMSCs group. *p ≤ 0.05; **p ≤ 0.01; ***p ≤ 0.001. D Quantitative flow cytometry data show the positive expressions of CD73, CD90, and CD105 and negative expressions of CD14, CD20, CD34, and CD45. Mean ± SD, n = 3. E Histogram view of specific MSC markers (solid line) and their isotype controls (shaded line). F Growth curves were calculated by counting cultured cells with the same seeding count during six days. Each line represents a passage number (three serial passages) with three replicates per day (n = 9). G DT was generated using cell counts at days 2 and 4 as the growth curve’s logarithm phase. Results are expressed as mean ± SD of nine replicates. Statistically significant difference compared with the hMSCs group. *p ≤ 0.05; **p ≤ 0.01; ***p ≤ 0.001. DT: Doubling time, MSC: Mesenchymal stromal cells; SCM: Subfractionation culturing method, cMSCs: Clonal mesenchymal stromal cells, BM: Bone marrow, hMSCs: Heterogeneous mesenchymal stromal cells

