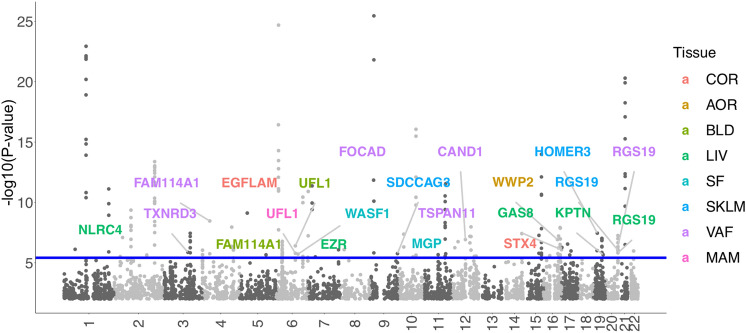
Fig. 2.
Manhattan plot of CAD TWAS results. The association results from STARNET- and GTEx-based models were integrated by lowest P values. The blue line marks P = 3.85e−6, i.e. transcriptome-wide significance. Each point corresponds to an association test between gene-tissue pair. 18 novel TWAS genes were highlighted. Supplementary Fig. 6 identifies all genes identified by their genetically-modulated association signals. The color code identifies the tissue in which the genes were differentially expressed by genetic means: AOR aorta, COR coronary artery, MAM mammary artery, BLD blood, LIV liver, SF subcutaneous fat, VAF visceral abdominal fat, SKLM skeletal muscle

