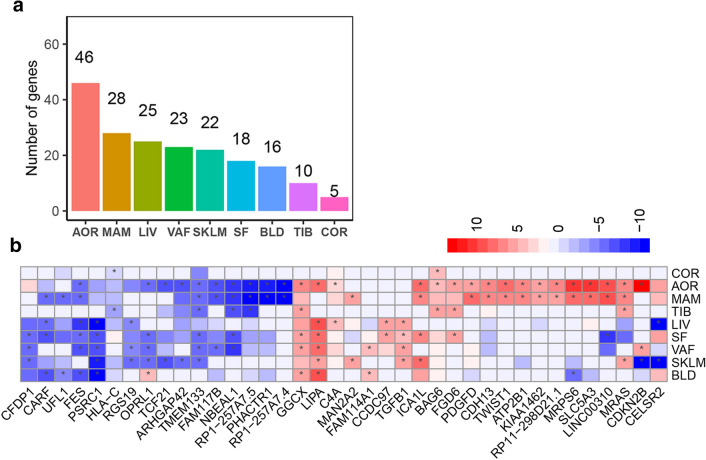
Fig. 3.
Tissue distribution of 114 TWAS genes of CAD. a Number of transcriptome-wide significant genes across tissues. b Heatmap plot of 38 genes identified in more than one tissues. The color codes indicate direction of effects. Cells marked with * represent significant gene-tissue pairs (P < 3.85e−6). AOR aorta, COR coronary artery, MAM mammary artery, BLD blood, LIV liver, SF subcutaneous fat, VAF visceral abdominal fat, SKLM skeletal muscle, TIB tibial artery

