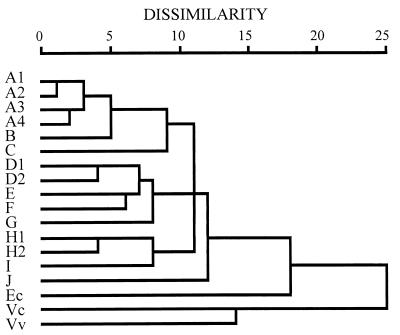
FIG. 5.
Dendrogram illustrating the clustering of amplification patterns of V. parahaemolyticus with RS-PCR. The dendrogram was produced using the squared Euclidean distance measure and average linkage clustering method with the program SPSS for Windows, Release 6.0. The dissimilarity units are arbitrary, being based on the sum of the squared Euclidian distance measure. Strains were arbitrarily grouped into different types. Letters at left designate the patterns.

