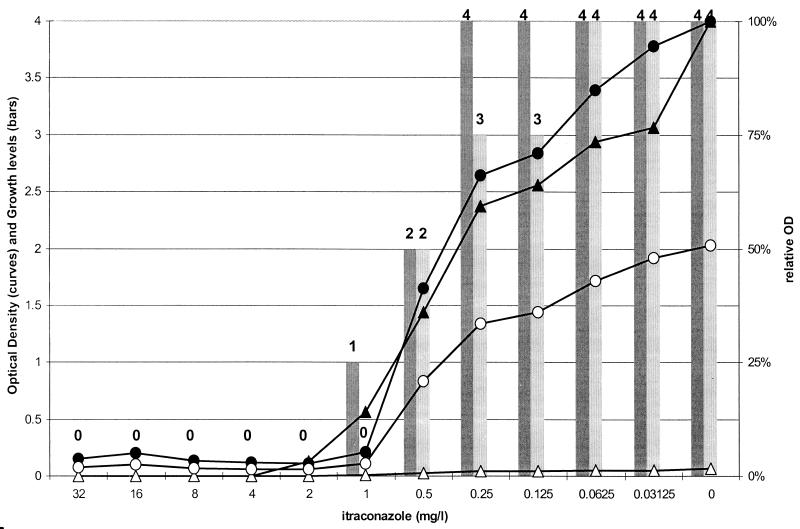
FIG. 1.
Results of susceptibility testing of an A. ustus strain against ITC in the NCCLS and XTT methods, with data determined visually and spectophotometrically, after 24 h of incubation. The bars represent the growth levels obtained in the NCCLSvis (dark bars) and XTTvis (light bars) methods for each concentration on a scale of 0 (absence of growth or color) to 4 (no reduction of growth or color compared with the data for the drug-free control). The curves with the circles represent the OD at 450 nm (open symbols) and the relative OD (percentage) (closed symbols) obtained by the XTTsp method. The curves with the triangles represent the OD at 405 nm (open symbols) and the relative OD (percentage) (closed symbols) obtained by the NCCLSsp method.

